Linking Specialisation and Stability of Plant ... - OPUS Würzburg
Linking Specialisation and Stability of Plant ... - OPUS Würzburg
Linking Specialisation and Stability of Plant ... - OPUS Würzburg

You also want an ePaper? Increase the reach of your titles
YUMPU automatically turns print PDFs into web optimized ePapers that Google loves.
3.5 discussion 51<br />
abundance<br />
150<br />
100<br />
50<br />
(a)<br />
400<br />
300<br />
200<br />
100<br />
(b)<br />
400 (c)<br />
300<br />
200<br />
100<br />
0<br />
1 4 7 11 16 21 26<br />
0<br />
1 4 7 11 16 21 26<br />
0<br />
1 4 7 11 16 21 26<br />
species rank<br />
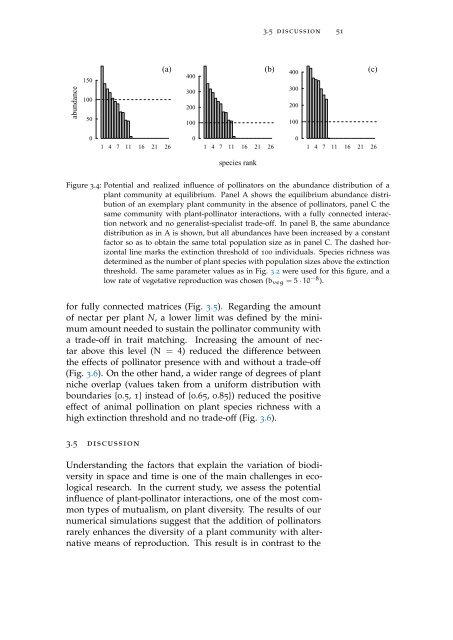
Figure 3.4: Potential <strong>and</strong> realized influence <strong>of</strong> pollinators on the abundance distribution <strong>of</strong> a<br />
plant community at equilibrium. Panel A shows the equilibrium abundance distribution<br />
<strong>of</strong> an exemplary plant community in the absence <strong>of</strong> pollinators, panel C the<br />
same community with plant-pollinator interactions, with a fully connected interaction<br />
network <strong>and</strong> no generalist-specialist trade-<strong>of</strong>f. In panel B, the same abundance<br />
distribution as in A is shown, but all abundances have been increased by a constant<br />
factor so as to obtain the same total population size as in panel C. The dashed horizontal<br />
line marks the extinction threshold <strong>of</strong> 100 individuals. Species richness was<br />
determined as the number <strong>of</strong> plant species with population sizes above the extinction<br />
threshold. The same parameter values as in Fig. 3.2 were used for this figure, <strong>and</strong> a<br />
low rate <strong>of</strong> vegetative reproduction was chosen (b veg = 5 · 10 −8 ).<br />
for fully connected matrices (Fig. 3.5). Regarding the amount<br />
<strong>of</strong> nectar per plant N, a lower limit was defined by the minimum<br />
amount needed to sustain the pollinator community with<br />
a trade-<strong>of</strong>f in trait matching. Increasing the amount <strong>of</strong> nectar<br />
above this level (N = 4) reduced the difference between<br />
the effects <strong>of</strong> pollinator presence with <strong>and</strong> without a trade-<strong>of</strong>f<br />
(Fig. 3.6). On the other h<strong>and</strong>, a wider range <strong>of</strong> degrees <strong>of</strong> plant<br />
niche overlap (values taken from a uniform distribution with<br />
boundaries {0.5, 1} instead <strong>of</strong> {0.65, 0.85}) reduced the positive<br />
effect <strong>of</strong> animal pollination on plant species richness with a<br />
high extinction threshold <strong>and</strong> no trade-<strong>of</strong>f (Fig. 3.6).<br />
3.5 discussion<br />
Underst<strong>and</strong>ing the factors that explain the variation <strong>of</strong> biodiversity<br />
in space <strong>and</strong> time is one <strong>of</strong> the main challenges in ecological<br />
research. In the current study, we assess the potential<br />
influence <strong>of</strong> plant-pollinator interactions, one <strong>of</strong> the most common<br />
types <strong>of</strong> mutualism, on plant diversity. The results <strong>of</strong> our<br />
numerical simulations suggest that the addition <strong>of</strong> pollinators<br />
rarely enhances the diversity <strong>of</strong> a plant community with alternative<br />
means <strong>of</strong> reproduction. This result is in contrast to the