Linking Specialisation and Stability of Plant ... - OPUS Würzburg
Linking Specialisation and Stability of Plant ... - OPUS Würzburg
Linking Specialisation and Stability of Plant ... - OPUS Würzburg

You also want an ePaper? Increase the reach of your titles
YUMPU automatically turns print PDFs into web optimized ePapers that Google loves.
5.5 discussion 97<br />
1.0<br />
●<br />
Bray−Curtis similarity <strong>of</strong> visited plants<br />
0.8<br />
0.6<br />
0.4<br />
0.2<br />
0.0<br />
●<br />
●<br />
●<br />
●<br />
● ●<br />
● ●<br />
●<br />
●<br />
●<br />
●●<br />
●<br />
●<br />
●<br />
●<br />
●<br />
●<br />
●<br />
● ●<br />
●<br />
● ● ●<br />
●<br />
●<br />
●<br />
● ●<br />
●<br />
●<br />
●<br />
●<br />
●<br />
●<br />
●<br />
●<br />
●<br />
●<br />
●<br />
●<br />
●<br />
● ●<br />
●<br />
●<br />
● ●<br />
●<br />
●<br />
● ●<br />
●<br />
● ●<br />
● ● ●●<br />
●<br />
● ● ● ● ●<br />
●●<br />
●<br />
● ●<br />
●<br />
●●<br />
●●<br />
●<br />
● ●<br />
●<br />
●<br />
●<br />
● ● ●<br />
●<br />
●<br />
● ●<br />
●<br />
●<br />
●<br />
●<br />
0.1 0.2 0.3 0.4 0.5<br />
Mean Bray−Curtis similarity <strong>of</strong> r<strong>and</strong>om plant samples<br />
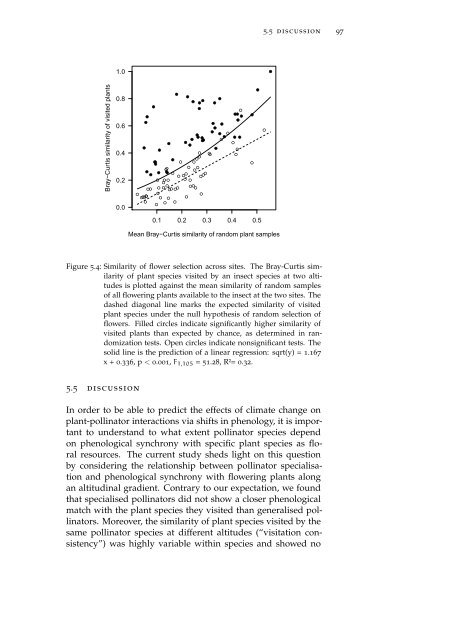
Figure 5.4: Similarity <strong>of</strong> flower selection across sites. The Bray-Curtis similarity<br />
<strong>of</strong> plant species visited by an insect species at two altitudes<br />
is plotted against the mean similarity <strong>of</strong> r<strong>and</strong>om samples<br />
<strong>of</strong> all flowering plants available to the insect at the two sites. The<br />
dashed diagonal line marks the expected similarity <strong>of</strong> visited<br />
plant species under the null hypothesis <strong>of</strong> r<strong>and</strong>om selection <strong>of</strong><br />
flowers. Filled circles indicate significantly higher similarity <strong>of</strong><br />
visited plants than expected by chance, as determined in r<strong>and</strong>omization<br />
tests. Open circles indicate nonsignificant tests. The<br />
solid line is the prediction <strong>of</strong> a linear regression: sqrt(y) = 1.167<br />
x + 0.336, p < 0.001, F 1,105 = 51.28, R²= 0.32.<br />
5.5 discussion<br />
In order to be able to predict the effects <strong>of</strong> climate change on<br />
plant-pollinator interactions via shifts in phenology, it is important<br />
to underst<strong>and</strong> to what extent pollinator species depend<br />
on phenological synchrony with specific plant species as floral<br />
resources. The current study sheds light on this question<br />
by considering the relationship between pollinator specialisation<br />
<strong>and</strong> phenological synchrony with flowering plants along<br />
an altitudinal gradient. Contrary to our expectation, we found<br />
that specialised pollinators did not show a closer phenological<br />
match with the plant species they visited than generalised pollinators.<br />
Moreover, the similarity <strong>of</strong> plant species visited by the<br />
same pollinator species at different altitudes (“visitation consistency”)<br />
was highly variable within species <strong>and</strong> showed no