Linking Specialisation and Stability of Plant ... - OPUS Würzburg
Linking Specialisation and Stability of Plant ... - OPUS Würzburg
Linking Specialisation and Stability of Plant ... - OPUS Würzburg

Create successful ePaper yourself
Turn your PDF publications into a flip-book with our unique Google optimized e-Paper software.
60 can plant-pollinator interactions promote plant diversity?<br />
proportional difference<br />
in species richness<br />
1.0<br />
0.5<br />
0.0<br />
−0.5<br />
−1.0<br />
low<br />
full matrix nested matrix diagonal matrix<br />
no trade−<strong>of</strong>f<br />
trade−<strong>of</strong>f<br />
high<br />
low high low high<br />
vegetative reproduction<br />
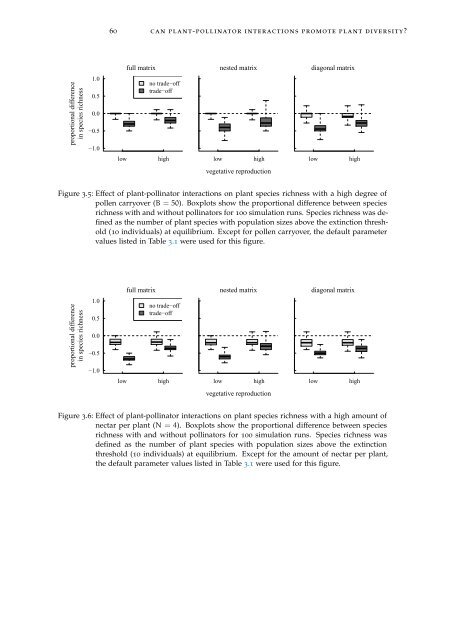
Figure 3.5: Effect <strong>of</strong> plant-pollinator interactions on plant species richness with a high degree <strong>of</strong><br />
pollen carryover (B = 50). Boxplots show the proportional difference between species<br />
richness with <strong>and</strong> without pollinators for 100 simulation runs. Species richness was defined<br />
as the number <strong>of</strong> plant species with population sizes above the extinction threshold<br />
(10 individuals) at equilibrium. Except for pollen carryover, the default parameter<br />
values listed in Table 3.1 were used for this figure.<br />
proportional difference<br />
in species richness<br />
1.0<br />
0.5<br />
0.0<br />
−0.5<br />
−1.0<br />
low<br />
full matrix nested matrix diagonal matrix<br />
no trade−<strong>of</strong>f<br />
trade−<strong>of</strong>f<br />
high<br />
low high low high<br />
vegetative reproduction<br />
Figure 3.6: Effect <strong>of</strong> plant-pollinator interactions on plant species richness with a high amount <strong>of</strong><br />
nectar per plant (N = 4). Boxplots show the proportional difference between species<br />
richness with <strong>and</strong> without pollinators for 100 simulation runs. Species richness was<br />
defined as the number <strong>of</strong> plant species with population sizes above the extinction<br />
threshold (10 individuals) at equilibrium. Except for the amount <strong>of</strong> nectar per plant,<br />
the default parameter values listed in Table 3.1 were used for this figure.