Linking Specialisation and Stability of Plant ... - OPUS Würzburg
Linking Specialisation and Stability of Plant ... - OPUS Würzburg
Linking Specialisation and Stability of Plant ... - OPUS Würzburg

You also want an ePaper? Increase the reach of your titles
YUMPU automatically turns print PDFs into web optimized ePapers that Google loves.
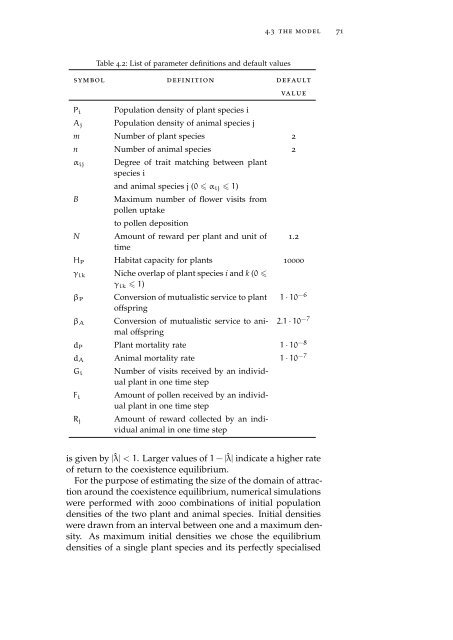
4.3 the model 71<br />
Table 4.2: List <strong>of</strong> parameter definitions <strong>and</strong> default values<br />
symbol definition default<br />
P i<br />
A j<br />
Population density <strong>of</strong> plant species i<br />
Population density <strong>of</strong> animal species j<br />
value<br />
m Number <strong>of</strong> plant species 2<br />
n Number <strong>of</strong> animal species 2<br />
α ij<br />
B<br />
N<br />
Degree <strong>of</strong> trait matching between plant<br />
species i<br />
<strong>and</strong> animal species j (0 α ij 1)<br />
Maximum number <strong>of</strong> flower visits from<br />
pollen uptake<br />
to pollen deposition<br />
Amount <strong>of</strong> reward per plant <strong>and</strong> unit <strong>of</strong><br />
time<br />
H P Habitat capacity for plants 10000<br />
γ ik<br />
β P<br />
β A<br />
Niche overlap <strong>of</strong> plant species i <strong>and</strong> k (0 <br />
γ ik 1)<br />
Conversion <strong>of</strong> mutualistic service to plant<br />
<strong>of</strong>fspring<br />
Conversion <strong>of</strong> mutualistic service to animal<br />
<strong>of</strong>fspring<br />
1.2<br />
1 · 10 −6<br />
2.1 · 10 −7<br />
d P <strong>Plant</strong> mortality rate 1 · 10 −8<br />
d A Animal mortality rate 1 · 10 −7<br />
G i<br />
F i<br />
R j<br />
Number <strong>of</strong> visits received by an individual<br />
plant in one time step<br />
Amount <strong>of</strong> pollen received by an individual<br />
plant in one time step<br />
Amount <strong>of</strong> reward collected by an individual<br />
animal in one time step<br />
is given by |ˆλ| < 1. Larger values <strong>of</strong> 1 − |ˆλ| indicate a higher rate<br />
<strong>of</strong> return to the coexistence equilibrium.<br />
For the purpose <strong>of</strong> estimating the size <strong>of</strong> the domain <strong>of</strong> attraction<br />
around the coexistence equilibrium, numerical simulations<br />
were performed with 2000 combinations <strong>of</strong> initial population<br />
densities <strong>of</strong> the two plant <strong>and</strong> animal species. Initial densities<br />
were drawn from an interval between one <strong>and</strong> a maximum density.<br />
As maximum initial densities we chose the equilibrium<br />
densities <strong>of</strong> a single plant species <strong>and</strong> its perfectly specialised