

Report PDF (3.7 MB) - USGS
Report PDF (3.7 MB) - USGS
Report PDF (3.7 MB) - USGS

You also want an ePaper? Increase the reach of your titles
YUMPU automatically turns print PDFs into web optimized ePapers that Google loves.
Use of Surrogate Models To Estimate Suspended Sediment 15<br />
The model between 0.5 MHz acoustic backscatter and<br />
SSC was poor (R 2 =0.007) because of a problem noted in<br />
the instrument noise level measurements. At high flows, the<br />
measured noise level increased substantially and was high<br />
relative to the raw backscatter measurement. The 0.5-MHz<br />
ADVM appears to be more sensitive to electrical and other<br />
noise that occurs in the water at high streamflows than the<br />
other evaluated frequencies (Craig Huhta, SonTek/Yellow<br />
Springs Instruments, oral commun., 2012). Because the<br />
instrument noise level is subtracted from the raw backscatter<br />
to compute SNR, in many cases this resulted in a low SNR<br />
when SSC was high. For comparison, a model was developed<br />
between the raw backscatter from the 0.5-MHz ADVM<br />
(without subtracting the noise level) and SSC, resulting in<br />
an improved R 2 of 0.89, but raw backscatter data collected<br />
during this period also could have been erroneous. Overall,<br />
the 3-MHz ADVM was still a better estimator of SSC than the<br />
other surrogates whether raw backscatter or SNR was used to<br />
develop the model.<br />
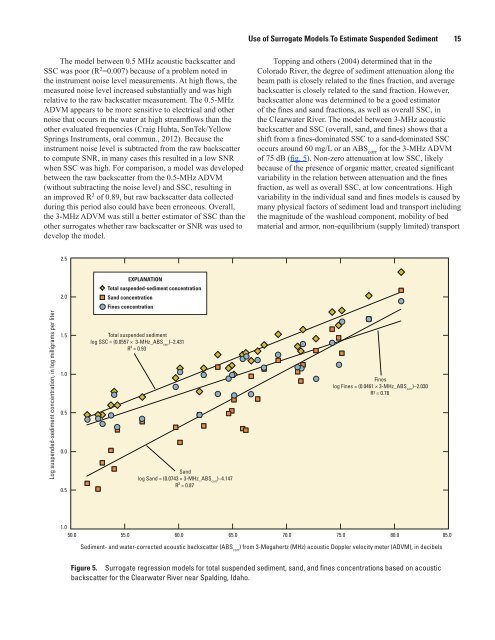
Topping and others (2004) determined that in the<br />
Colorado River, the degree of sediment attenuation along the<br />
beam path is closely related to the fines fraction, and average<br />
backscatter is closely related to the sand fraction. However,<br />
backscatter alone was determined to be a good estimator<br />
of the fines and sand fractions, as well as overall SSC, in<br />
the Clearwater River. The model between 3-MHz acoustic<br />
backscatter and SSC (overall, sand, and fines) shows that a<br />
shift from a fines-dominated SSC to a sand-dominated SSC<br />
occurs around 60 mg/L or an ABS corr<br />
for the 3-MHz ADVM<br />
of 75 dB (fig. 5). Non-zero attenuation at low SSC, likely<br />
because of the presence of organic matter, created significant<br />
variability in the relation between attenuation and the fines<br />
fraction, as well as overall SSC, at low concentrations. High<br />
variability in the individual sand and fines models is caused by<br />
many physical factors of sediment load and transport including<br />
the magnitude of the washload component, mobility of bed<br />
material and armor, non-equilibrium (supply limited) transport<br />
2.5<br />
EXPLANATION<br />
2.0<br />
Total suspended-sediment concentration<br />
Sand concentration<br />
Fines concentration<br />
Log suspended-sediment concentration, in log milligrams per liter<br />
1.5<br />
1.0<br />
0.5<br />
0.0<br />
0.5<br />
Total suspended sediment<br />
log SSC = (0.0557 × 3-MHz_ABS corr<br />
)−2.431<br />
R² = 0.93<br />
Sand<br />
log Sand = (0.0743 × 3-MHz_ABS corr<br />
)−4.147<br />
R² = 0.87<br />
Fines<br />
log Fines = (0.0461 × 3-MHz_ABS corr<br />
)−2.030<br />
R² = 0.78<br />
1.0<br />
50.0 55.0 60.0 65.0 70.0 75.0 80.0 85.0<br />
Sediment- and water-corrected acoustic backscatter (ABS corr<br />
) from 3-Megahertz (MHz) acoustic Doppler velocity meter (ADVM), in decibels<br />
Figure 5. Surrogate regression models for total suspended sediment, sand, and fines concentrations based on acoustic<br />
backscatter for the Clearwater River near Spalding, Idaho.


