

Report PDF (3.7 MB) - USGS
Report PDF (3.7 MB) - USGS
Report PDF (3.7 MB) - USGS

Create successful ePaper yourself
Turn your PDF publications into a flip-book with our unique Google optimized e-Paper software.
24 Surrogate Technologies to Estimate Suspended Sediment, Clearwater River, Idaho, and Snake River, Wash., 2008–10<br />
450,000<br />
400,000<br />
350,000<br />
A.<br />
EXPLANATION<br />
3-MHz_ABS corr<br />
Model<br />
2008–10 sediment-transport curve<br />
1970s sediment-transport curve<br />
300,000<br />
250,000<br />
200,000<br />
150,000<br />
Suspended-sediment load, in tons per month<br />
100,000<br />
50,000<br />
0<br />
2,000,000<br />
1,800,000<br />
1,600,000<br />
B.<br />
EXPLANATION<br />
1.5-MHz_ABS corr<br />
Model<br />
2008–10 sediment-transport curve<br />
1970s sediment-transport curve<br />
1,400,000<br />
1,200,000<br />
1,000,000<br />
800,000<br />
600,000<br />
400,000<br />
200,000<br />
0<br />
Jan. Feb. Mar. Apr. May June July Aug. Sept. Oct. Nov. Dec.<br />
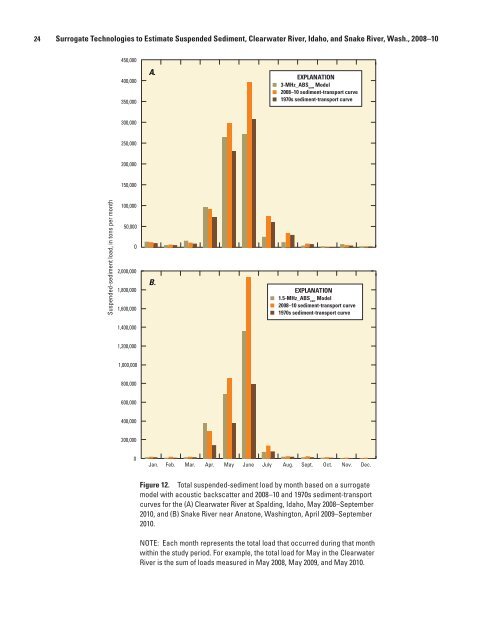
Figure 12. Total suspended-sediment load by month based on a surrogate<br />
model with acoustic backscatter and 2008–10 and 1970s sediment-transport<br />
curves for the (A) Clearwater River at Spalding, Idaho, May 2008–September<br />
2010, and (B) Snake River near Anatone, Washington, April 2009–September<br />
2010.<br />
NOTE: Each month represents the total load that occurred during that month<br />
within the study period. For example, the total load for May in the Clearwater<br />
River is the sum of loads measured in May 2008, May 2009, and May 2010.<br />
tac13-0799_fig 12


