

Report PDF (3.7 MB) - USGS
Report PDF (3.7 MB) - USGS
Report PDF (3.7 MB) - USGS

You also want an ePaper? Increase the reach of your titles
YUMPU automatically turns print PDFs into web optimized ePapers that Google loves.
18 Surrogate Technologies to Estimate Suspended Sediment, Clearwater River, Idaho, and Snake River, Wash., 2008–10<br />
Snake River Study Site<br />
Acoustic backscatter was shown to be as good of<br />
an estimator for SSC in the Snake River as it was in the<br />
Clearwater River, despite the shorter period of record during<br />
which the ADVMs were installed and fewer samples available<br />
for the calibration (table 3). Similar to the Clearwater River,<br />
the model between 0.5-MHz ADVM backscatter and SSC<br />
was poor owing to high noise levels at high flows resulting<br />
in an inverse relation between SNR and SSC. A model<br />
developed between the raw backscatter from the 0.5-MHz<br />
ADVM (without subtracting the noise level) and SSC resulted<br />
in an improved R 2 of 0.67 but was still inferior to the model<br />
between the 1.5-MHz ADVM and SSC.<br />
Discrete samples collected to assess cross-sectional<br />
variability in SSC show that inflows from the upstream<br />
tributary Grande Ronde River are not always well-mixed<br />
with the Snake River at the study site. Standard deviation<br />
among discrete samples was higher for the Snake River than<br />
for the Clearwater River, ranging from 15 mg/L at low SSC<br />
to 185 mg/L at high SSC. The surrogate instruments likely<br />
measure a zone of average to above-average SSC relative<br />
to the entire cross section because water from the Grande<br />
Ronde River adjoins the left bank and does not fully mix with<br />
the Snake River flow before the measurement site. As at the<br />
Clearwater River site, the ADVMs at the Snake River site are<br />
able to better represent cross-sectional variability than other<br />
surrogates.<br />
Following a transformation back to original units, the<br />
selected regression model for estimating SSC at the Snake<br />
River site is:<br />
SSC = 10 [(0.0756 × 1.5-MHz_ABScorr) – 4.676] ×1.048 (8)<br />
where<br />
SSC is the suspended-sediment concentration<br />
(mg/L),<br />
1.5-MHz_ABS corr<br />
is the range-normalized acoustic backscatter<br />
from the 1.5-MHz ADVM corrected for twoway<br />
transmission losses (dB), and<br />
1.048 is Duan’s bias correction factor.<br />
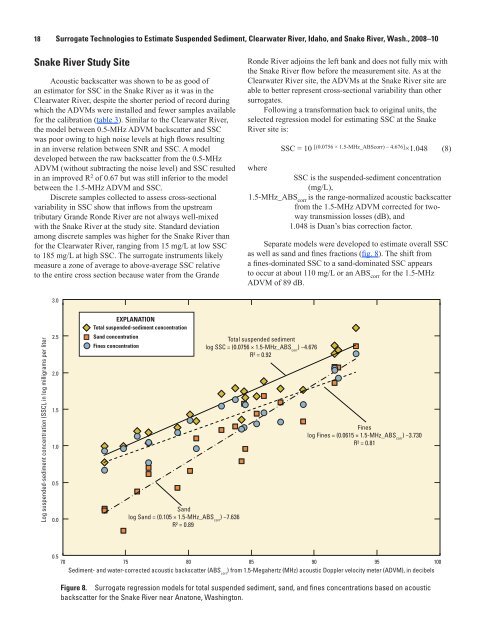
Separate models were developed to estimate overall SSC<br />
as well as sand and fines fractions (fig. 8). The shift from<br />
a fines-dominated SSC to a sand-dominated SSC appears<br />
to occur at about 110 mg/L or an ABS corr<br />
for the 1.5-MHz<br />
ADVM of 89 dB.<br />
3.0<br />
Log suspended-sediment concentration (SSC), in log milligrams per liter<br />
2.5<br />
2.0<br />
1.5<br />
1.0<br />
0.5<br />
0.0<br />
EXPLANATION<br />
Total suspended-sediment concentration<br />
Sand concentration<br />
Fines concentration<br />
Sand<br />
log Sand = (0.105 × 1.5-MHz_ABS corr<br />
) −7.636<br />
R² = 0.89<br />
Total suspended sediment<br />
log SSC = (0.0756 × 1.5-MHz_ABS corr<br />
) −4.676<br />
R² = 0.92<br />
Fines<br />
log Fines = (0.0615 × 1.5-MHz_ABS corr<br />
) −<strong>3.7</strong>30<br />
R² = 0.81<br />
0.5<br />
70 75 80 85 90 95 100<br />
Sediment- and water-corrected acoustic backscatter (ABS corr<br />
) from 1.5-Megahertz (MHz) acoustic Doppler velocity meter (ADVM), in decibels<br />
Figure 8. Surrogate regression models for total suspended sediment, sand, and fines concentrations based on acoustic<br />
backscatter for the Snake River near Anatone, Washington.


