

Report PDF (3.7 MB) - USGS
Report PDF (3.7 MB) - USGS
Report PDF (3.7 MB) - USGS

Create successful ePaper yourself
Turn your PDF publications into a flip-book with our unique Google optimized e-Paper software.
20 Surrogate Technologies to Estimate Suspended Sediment, Clearwater River, Idaho, and Snake River, Wash., 2008–10<br />
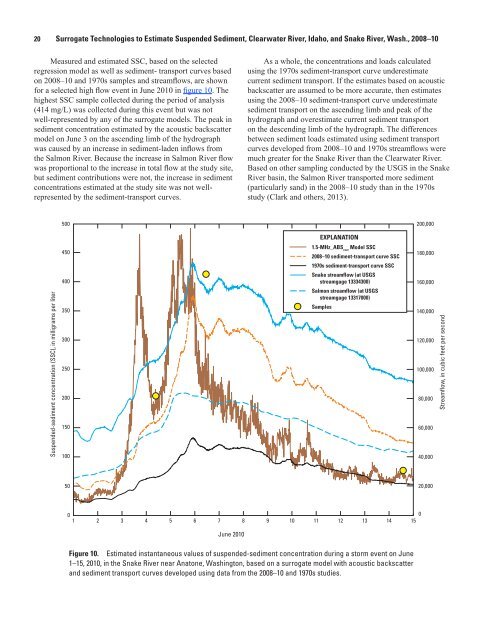
Measured and estimated SSC, based on the selected<br />
regression model as well as sediment- transport curves based<br />
on 2008–10 and 1970s samples and streamflows, are shown<br />
for a selected high flow event in June 2010 in figure 10. The<br />
highest SSC sample collected during the period of analysis<br />
(414 mg/L) was collected during this event but was not<br />
well-represented by any of the surrogate models. The peak in<br />
sediment concentration estimated by the acoustic backscatter<br />
model on June 3 on the ascending limb of the hydrograph<br />
was caused by an increase in sediment-laden inflows from<br />
the Salmon River. Because the increase in Salmon River flow<br />
was proportional to the increase in total flow at the study site,<br />
but sediment contributions were not, the increase in sediment<br />
concentrations estimated at the study site was not wellrepresented<br />
by the sediment-transport curves.<br />
As a whole, the concentrations and loads calculated<br />
using the 1970s sediment-transport curve underestimate<br />
current sediment transport. If the estimates based on acoustic<br />
backscatter are assumed to be more accurate, then estimates<br />
using the 2008–10 sediment-transport curve underestimate<br />
sediment transport on the ascending limb and peak of the<br />
hydrograph and overestimate current sediment transport<br />
on the descending limb of the hydrograph. The differences<br />
between sediment loads estimated using sediment transport<br />
curves developed from 2008–10 and 1970s streamflows were<br />
much greater for the Snake River than the Clearwater River.<br />
Based on other sampling conducted by the <strong>USGS</strong> in the Snake<br />
River basin, the Salmon River transported more sediment<br />
(particularly sand) in the 2008–10 study than in the 1970s<br />
study (Clark and others, 2013).<br />
500<br />
200,000<br />
EXPLANATION<br />
Suspended-sediment concentration (SSC), in milligrams per liter<br />
450<br />
400<br />
350<br />
300<br />
250<br />
200<br />
150<br />
100<br />
1.5-MHz_ABS corr<br />
Model SSC<br />
2008–10 sediment-transport curve SSC<br />
1970s sediment-transport curve SSC<br />
Snake streamflow (at <strong>USGS</strong><br />
streamgage 13334300)<br />
Salmon streamflow (at <strong>USGS</strong><br />
streamgage 13317000)<br />
Samples<br />
180,000<br />
160,000<br />
140,000<br />
120,000<br />
100,000<br />
80,000<br />
60,000<br />
40,000<br />
Streamflow, in cubic feet per second<br />
50<br />
20,000<br />
0<br />
0<br />
1 2 3 4 5 6 7 8 9 10 11 12 13 14 15<br />
June 2010<br />
Figure 10. Estimated instantaneous values of suspended-sediment concentration during a storm event on June<br />
1–15, 2010, in the Snake River near Anatone, Washington, based on a surrogate model with acoustic backscatter<br />
and sediment transport curves developed using data from the 2008–10 and 1970s studies.


