

Report PDF (3.7 MB) - USGS
Report PDF (3.7 MB) - USGS
Report PDF (3.7 MB) - USGS

You also want an ePaper? Increase the reach of your titles
YUMPU automatically turns print PDFs into web optimized ePapers that Google loves.
22 Surrogate Technologies to Estimate Suspended Sediment, Clearwater River, Idaho, and Snake River, Wash., 2008–10<br />
250<br />
5948 5236 5895 5742 8147 8624 8858 8814 6999 6999 3977 5666<br />
A.<br />
EXPLANATION<br />
200<br />
30 number of<br />
values<br />
upper detached<br />
150<br />
upper outside<br />
upper adjacent<br />
100<br />
75th percentile<br />
median<br />
Suspended-sediment concentration, in milligrams per liter<br />
50<br />
0<br />
250<br />
200<br />
150<br />
B.<br />
5948 5236 5895 5742 8147 8624 8858 8814 6999 6999 3977 5666<br />
25th percentile<br />
lower adjacent<br />
lower outside<br />
lower detached<br />
100<br />
50<br />
0<br />
Jan. Feb. Mar. Apr. May June July Aug. Sept. Oct. Nov. Dec.<br />
x<br />
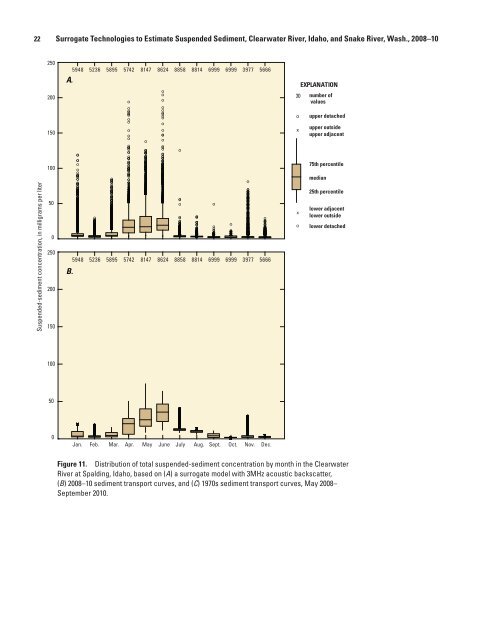
Figure 11. Distribution of total suspended-sediment concentration by month in the Clearwater<br />
River at Spalding, Idaho, based on (A) a surrogate model with 3MHz acoustic backscatter,<br />
(B) 2008–10 sediment transport curves, and (C) 1970s sediment transport curves, May 2008–<br />
September 2010.<br />
tac13-0799_fig 11ab


