

Report PDF (3.7 MB) - USGS
Report PDF (3.7 MB) - USGS
Report PDF (3.7 MB) - USGS

You also want an ePaper? Increase the reach of your titles
YUMPU automatically turns print PDFs into web optimized ePapers that Google loves.
16 Surrogate Technologies to Estimate Suspended Sediment, Clearwater River, Idaho, and Snake River, Wash., 2008–10<br />
of sediment, relative magnitudes of the tributary flows,<br />
timing of releases of stored water for water management, and<br />
proximity of episodic sediment sources. The uncertainty and<br />
stochasticity of the relations between these factors motivated<br />
the USACE’s interest in the use of surrogate sediment<br />
measurement technology in this study.<br />
The selected regression based on 3-MHz acoustic<br />
backscatter represented 93 percent of the variability in SSC<br />
and resulted in an average RPD between measured and<br />
estimated SSC of +8.6 percent. Standard error for the 3-MHz<br />
model was lower and variance in residuals was lower and<br />
more constant than for all other models indicating best fit.<br />
Best agreement (lowest RPD) was observed when fines were<br />
between about 70 and 85 percent of total SSC. Estimates of<br />
SSC when the sand fraction was high were not substantially<br />
improved by using the model with the 0.5-MHz ADVM, even<br />
when using a model that did not incorporate the continuously<br />
measured noise level. This is likely because most of the sand<br />
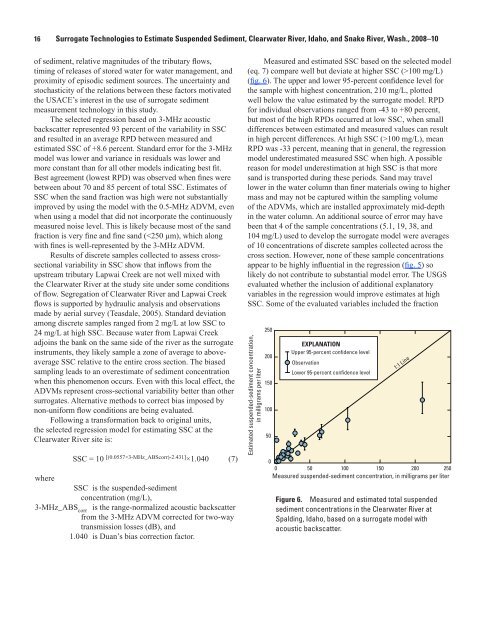
fraction is very fine and fine sand (100 mg/L)<br />
(fig. 6). The upper and lower 95-percent confidence level for<br />
the sample with highest concentration, 210 mg/L, plotted<br />
well below the value estimated by the surrogate model. RPD<br />
for individual observations ranged from -43 to +80 percent,<br />
but most of the high RPDs occurred at low SSC, when small<br />
differences between estimated and measured values can result<br />
in high percent differences. At high SSC (>100 mg/L), mean<br />
RPD was -33 percent, meaning that in general, the regression<br />
model underestimated measured SSC when high. A possible<br />
reason for model underestimation at high SSC is that more<br />
sand is transported during these periods. Sand may travel<br />
lower in the water column than finer materials owing to higher<br />
mass and may not be captured within the sampling volume<br />
of the ADVMs, which are installed approximately mid-depth<br />
in the water column. An additional source of error may have<br />
been that 4 of the sample concentrations (5.1, 19, 38, and<br />
104 mg/L) used to develop the surrogate model were averages<br />
of 10 concentrations of discrete samples collected across the<br />
cross section. However, none of these sample concentrations<br />
appear to be highly influential in the regression (fig. 5) so<br />
likely do not contribute to substantial model error. The <strong>USGS</strong><br />
evaluated whether the inclusion of additional explanatory<br />
variables in the regression would improve estimates at high<br />
SSC. Some of the evaluated variables included the fraction<br />
Estimated suspended-sediment concentration,<br />
in milligrams per liter<br />
250<br />
200<br />
150<br />
100<br />
50<br />
EXPLANATION<br />
Upper 95-percent confidence level<br />
Observation<br />
Lower 95-percent confidence level<br />
1:1 Line<br />
0<br />
0 50 100 150 200 250<br />
Measured suspended-sediment concentration, in milligrams per liter<br />
Figure 6. Measured and estimated total suspended<br />
sediment concentrations in the Clearwater River at<br />
Spalding, Idaho, based on a surrogate model with<br />
acoustic backscatter.


