geothermal resource potential of the safford-san simon basin, arizona
geothermal resource potential of the safford-san simon basin, arizona
geothermal resource potential of the safford-san simon basin, arizona

Create successful ePaper yourself
Turn your PDF publications into a flip-book with our unique Google optimized e-Paper software.
geo<strong>the</strong>rmometry for waters containing higher calcium, chloride, and sulfate<br />
concentrations are believed unreliable due to possible mixing, dissolution <strong>of</strong><br />
gypsum,<br />
and cation exchange reactions with clay in <strong>the</strong> <strong>basin</strong>-fill sediments.<br />
Na-K-Ca geo<strong>the</strong>rmometry assumes that temperature-dependent equilibrium with<br />
silicate minerals in <strong>the</strong> reservoir has occurred and that no additional reactions<br />
have changed <strong>the</strong> ratios <strong>of</strong> sodium, potassium, and calcium after <strong>the</strong><br />
<strong>the</strong>rmal water leaves <strong>the</strong> deep reservoir (Fournier and o<strong>the</strong>rs, 1974).<br />
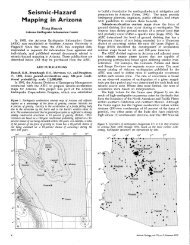
Figure<br />
30 is a map <strong>of</strong> <strong>the</strong> Bowie area showing <strong>the</strong> distribution <strong>of</strong> <strong>the</strong> Na-K-Ca geo<strong>the</strong>rmometer<br />
temperatures.<br />
Wells with <strong>the</strong> highest Na-K-Ca temperatures may<br />
overlie fractured basement, which is leaking <strong>the</strong>rmal water into shallow<br />
«600 m) aquifers. Additional studies are required to confirm <strong>the</strong> high Na-K<br />
Ca geo<strong>the</strong>rmometer temperatures obtained using <strong>the</strong> low magnesium,<br />
sodium bicarbonate<br />
waters because <strong>the</strong> sodium, potassium and calcium ratios may also<br />
reflect shallow nontemperature-dependent dissolution <strong>of</strong> silicate minerals<br />
in a high dissolved carbon dioxide environment (Paces, 1975).<br />
Structure and Stratigraphy<br />
Geophysical studies by Eaton (1972)<br />
and drillers' logs provide a basis<br />
to describe <strong>the</strong> subsurface geology in <strong>the</strong> Bowie area.<br />
Eaton (1972) published<br />
a subsurface model <strong>of</strong> structure based upon an accompanying gravity pr<strong>of</strong>ile.<br />
Figure 31 shows Eaton's structural model and gravity pr<strong>of</strong>ile.<br />
His pr<strong>of</strong>ile<br />
locations are shown in Figure 32, Gravity interpretation by Eaton (1972) shows a<br />
graben, which is about five miles wide and filled with up to 760 m <strong>of</strong> clastic<br />
sediment.<br />
Tertiary volcanic rock, 300 to 600 m thickness, are modeled to<br />
underlie <strong>the</strong> <strong>basin</strong>-fill sediments.<br />
Drillers' logs published in 'fuite (1963) and White and Smith (1965) show<br />
<strong>the</strong> stratigraphy <strong>of</strong> <strong>the</strong> upper portion <strong>of</strong> <strong>the</strong> <strong>basin</strong>-filling sediments in <strong>the</strong><br />
Bowie graben (see drillers' logs in <strong>the</strong> appendix),<br />
A "blue clay" strata,<br />
79