geothermal resource potential of the safford-san simon basin, arizona
geothermal resource potential of the safford-san simon basin, arizona
geothermal resource potential of the safford-san simon basin, arizona

Create successful ePaper yourself
Turn your PDF publications into a flip-book with our unique Google optimized e-Paper software.
(X)<br />
N<br />
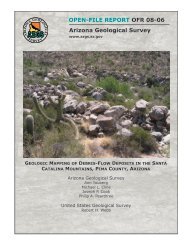
BOUGUER GRAVITY MAP OF BOWIE' AREA WITH<br />
WATER FALLS AND PROFILE USED TO MODEL<br />
'I I<br />
,/:~----7~\-~;iR<br />
... ~«-- .I<br />
_t\/\>~ . /<br />
):fte1lC1-~ •<br />
r~~I<br />
l~,~':J<br />
, -,,,.<br />
fi~~?\:- -~-J<br />
,<br />
1\ C' .<br />
-:?'~4 ./1<br />
.; ';' '.ii.,~'b \"<br />
{<br />
- ' j 1,\<br />
\1<br />
,I "'/,\ \<br />
-"r I,<br />
'<br />
",,'<br />
J<br />
,~..~. II _ .. " ~.l'~<br />
, .~.<br />
t--"-'--t-'<br />
1 \ I~I W~-ldl'ljI:<br />
\ I<br />
t~v><br />
Center<br />
LOCATIONS OF GROUND<br />
SUBSURFACE STRUCTURE<br />
GA<br />
<strong>of</strong> Bouguer Gravity<br />
Anomaly East <strong>of</strong> BOWIe<br />
Bouguer Gravity contour<br />
Contour interval is 5 mi lIigals<br />
1975, Ground-water fall (See<br />
Figure 34, Ground-water Table<br />
Map <strong>of</strong> <strong>the</strong>.Bowie area,)<br />
A<br />
AI<br />
Gravity pr<strong>of</strong>ile used to model<br />
subsurface geology, (See Figure 31<br />
Gravity<br />
DATA<br />
Model <strong>of</strong> Bowie Area.)<br />
SOURCES:<br />
(I) 'GRAVITY-Wynn and Dansereau, 1979.<br />
(2) PROFI LE - Eaton t<br />
1972.<br />
(3}GROUND-WATER TABLE -Information<br />
for 1975 j Wilson and White, 1976.<br />
BASE:<br />
N<br />
--160-<br />
-r-<br />
US, Geological Survey 1:25Q!000, Silver City, 1970,<br />
SCALE: 1:250,000 0 6 Miles<br />
I I I « , I I<br />
Figure 32.<br />
Bouguer gravity map <strong>of</strong> Bowie area compared to' locations <strong>of</strong> ground-water falls.