Annual Report 2012 - ORCO Germany
Annual Report 2012 - ORCO Germany
Annual Report 2012 - ORCO Germany

You also want an ePaper? Increase the reach of your titles
YUMPU automatically turns print PDFs into web optimized ePapers that Google loves.
___________________________________________________________________________<br />
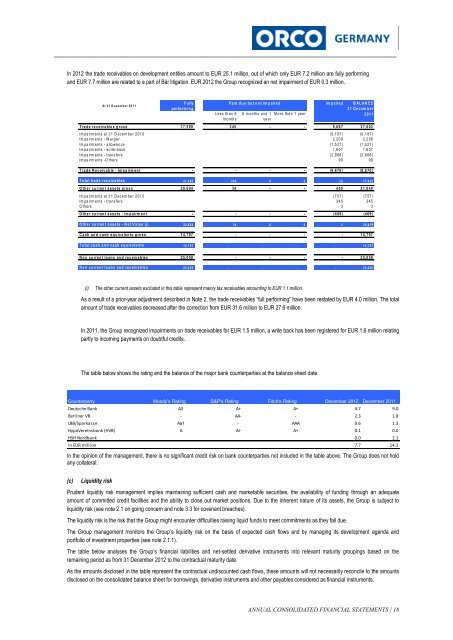
In <strong>2012</strong> the trade receivables on development entities amount to EUR 25.1 million, out of which only EUR 7.2 million are fully performing<br />
and EUR 7.7 million are related to a part of Bär litigation. EUR <strong>2012</strong> the Group recognized an net impairment of EUR 0.3 million.<br />
At 3 1 D e c e m b e r 2 0 1 1<br />
F u lly<br />
p e rfo rm in g<br />
L e s s th a n 6<br />
m o n th s<br />
P a s t d u e b u t n o t im p a ire d Im p a ire d B A L A N C E<br />
3 1 D e c e m b e r<br />
2 0 1 1<br />
6 m o n th s a n d 1 M o re th a n 1 yea r<br />
ye a r<br />
T ra d e re c e iv a b le s g r o s s 1 7 ,5 9 0 3 4 5 - - 9 ,6 6 7 2 7 ,6 0 2<br />
Im p a ir m e n ts a t 3 1 D e c e m b e r 2 0 1 0 (9 ,1 8 7 ) (9 ,1 8 7 )<br />
Im p a ir m e n ts - M e rg e r 2 ,2 0 6 2 ,2 0 6<br />
Im p a ir m e n ts - a llo w a n ce (1 ,5 2 7 ) (1 ,5 2 7 )<br />
Im p a ir m e n ts - w rite -b a ck 1 ,6 0 7 1 ,6 0 7<br />
Im p a ir m e n ts - tra n s fe rs (2 ,8 6 8 ) (2 ,8 6 8 )<br />
Im p a ir m e n ts -O th e rs 99 99<br />
T ra d e R e c e iv a b le - Im p a irm e n t - - - - (9 ,6 7 0 ) (9 ,6 7 0 )<br />
T o ta l tra d e re c e iv a b le s 2 1 ,5 9 0 3 4 5 0 0 (3) 1 7 ,9 3 2<br />
O th e r c u r re n t a s s e ts g ro s s 2 0 ,6 0 4 34 - - 409 2 1 ,0 4 8<br />
Im p a ir m e n ts a t 3 1 D e c e m b e r 2 0 1 0 (7 5 7 ) (7 5 7 )<br />
Im p a ir m e n ts - tra n s fe rs 345 3 4 5<br />
O th e rs 3 3<br />
O th e r c u r re n t a s s e ts - Im p a irm e n t - - - - (4 0 9 ) (4 0 9 )<br />
O th e r c u r re n t a s s e ts - N e t V a lu e (i) 2 0 ,6 0 4 34 0 0 0 2 0 ,6 3 9<br />
C a s h a n d c a s h e q u iv a le n t s g ro s s 1 4 ,7 9 7 - - - - 1 4 ,7 9 7<br />
T o ta l c a s h a n d c a s h e q u iv a le n t s 1 4 ,7 9 7 - - - - 1 4 ,7 9 7<br />
N o n c u rre n t lo a n s a n d re c e iv a b le s 2 5 ,0 5 0 - - - - 2 5 ,0 5 0<br />
N o n c u rre n t lo a n s a n d re c e iv a b le s 2 5 ,0 5 0 - - - - 2 5 ,0 5 0<br />
(i)<br />
The other current assets excluded in this table represent mainly tax receivables amounting to EUR 1.1 million.<br />
As a result of a prior-year adjustment described in Note 2, the trade receivables “full performing” have been restated by EUR 4.0 million. The total<br />
amount of trade receivables decreased after the correction from EUR 31.6 million to EUR 27.6 million.<br />
In 2011, the Group recognized impairments on trade receivables for EUR 1.5 million, a write back has been registered for EUR 1.6 million relating<br />
partly to incoming payments on doubtful credits.<br />
The table below shows the rating and the balance of the major bank counterparties at the balance sheet date.<br />
Counterparty Moody's Rating S&P's Rating Fitch's Rating December <strong>2012</strong> December 2011<br />
Deutsche Bank A2 A+ A+ 4.7 9.0<br />
Berliner VB - AA- - 2.3 1.8<br />
LBB/Sparkasse Aa1 - AAA 0.6 1.3<br />
HypoVereinsbank (HVB) A A+ A+ 0.1 0.0<br />
HSH Nordbank 0.0 2.1<br />
in EUR million 7.7 14.3<br />
In the opinion of the management, there is no significant credit risk on bank counterparties not included in the table above. The Group does not hold<br />
any collateral.<br />
(c)<br />
Liquidity risk<br />
Prudent liquidity risk management implies maintaining sufficient cash and marketable securities, the availability of funding through an adequate<br />
amount of committed credit facilities and the ability to close out market positions. Due to the inherent nature of its assets, the Group is subject to<br />
liquidity risk (see note 2.1 on going concern and note 3.3 for covenant breaches).<br />
The liquidity risk is the risk that the Group might encounter difficulties raising liquid funds to meet commitments as they fall due.<br />
The Group management monitors the Group’s liquidity risk on the basis of expected cash flows and by managing its development agenda and<br />
portfolio of investment properties (see note 2.1.1).<br />
The table below analyses the Group’s financial liabilities and net-settled derivative instruments into relevant maturity groupings based on the<br />
remaining period as from 31 December <strong>2012</strong> to the contractual maturity date.<br />
As the amounts disclosed in the table represent the contractual undiscounted cash flows, these amounts will not necessarily reconcile to the amounts<br />
disclosed on the consolidated balance sheet for borrowings, derivative instruments and other payables considered as financial instruments.<br />
ANNUAL CONSOLIDATED FINANCIAL STATEMENTS | 18