Annual Report 2012 - ORCO Germany
Annual Report 2012 - ORCO Germany
Annual Report 2012 - ORCO Germany

You also want an ePaper? Increase the reach of your titles
YUMPU automatically turns print PDFs into web optimized ePapers that Google loves.
___________________________________________________________________________<br />
F in a n c ia l in s tru m e n ts<br />
3 1 D e c e m b e r 2 0 1 1<br />
L o a n s a n d R e c e iv a b le s<br />
A s s e t a t fa ir v a lu e<br />
th ro u g h p ro fit o r<br />
lo s s<br />
3 1 D e c e m b e r<br />
2 0 1 1<br />
F in a n c ia l a s se ts a t fa ir va lu e th ro u g h p r o fit o r lo s s - 1 ,2 1 6 1 ,2 1 6<br />
C u rre n t fin a n c ia l a s s e ts 27 - 27<br />
T ra d e a n d o th e r re c e iva b le s 3 9 ,7 0 7 - 3 9 ,7 0 7<br />
N o n c u rr e n t lo a n s a n d re c e iva b le s - 2 5 ,0 5 1 2 5 ,0 5 1<br />
C a sh a n d ca sh e q u iva le n t 1 4 ,7 9 7 - 1 4 ,7 9 7<br />
F in a n c ia l A s s e ts 5 4 ,5 3 1 2 6 ,2 6 7 8 0 ,7 9 8<br />
O th e r fin a n c ia l<br />
lia b ilitie s a t a m o rtis e d<br />
c o s t<br />
L ia b ilitie s a t fa ir v a lu e<br />
th ro u g h p ro fit o r lo s s<br />
T O T A L<br />
F in a n c ia l d e b ts a n d b o n d s 5 4 5 ,2 6 0 - 5 4 5 ,2 6 0<br />
D e riv a tive s - 2 9 ,8 4 2 2 9 ,8 4 2<br />
T ra d e a n d o th e r p a yab le s 4 ,4 6 5 - 4 ,4 6 5<br />
F in a n c ia l L ia b ilitie s 5 4 9 ,7 2 5 2 9 ,8 4 2 5 7 9 ,5 6 7<br />
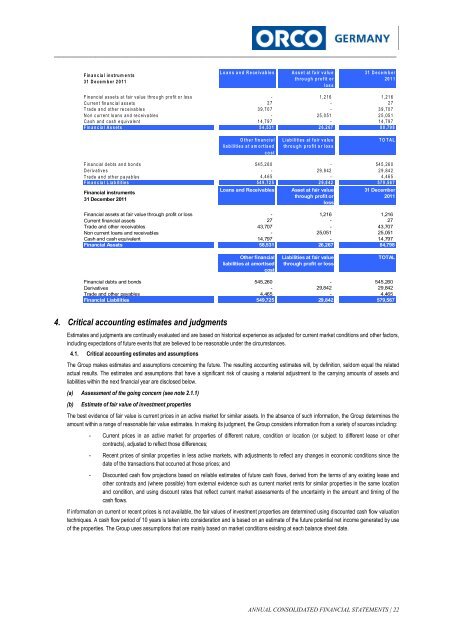
Financial instruments<br />
31 December 2011<br />
Loans and Receivables<br />
Asset at fair value<br />
through profit or<br />
loss<br />
31 December<br />
2011<br />
Financial assets at fair value through profit or loss - 1,216 1,216<br />
Current financial assets 27 - 27<br />
Trade and other receivables 43,707 - 43,707<br />
Non current loans and receivables - 25,051 25,051<br />
Cash and cash equivalent 14,797 - 14,797<br />
Financial Assets 58,531 26,267 84,798<br />
Other financial<br />
liabilities at amortised<br />
cost<br />
Liabilities at fair value<br />
through profit or loss<br />
TOTAL<br />
Financial debts and bonds 545,260 - 545,260<br />
Derivatives - 29,842 29,842<br />
Trade and other payables 4,465 - 4,465<br />
Financial Liabilities 549,725 29,842 579,567<br />
4. Critical accounting estimates and judgments<br />
Estimates and judgments are continually evaluated and are based on historical experience as adjusted for current market conditions and other factors,<br />
including expectations of future events that are believed to be reasonable under the circumstances.<br />
4.1. Critical accounting estimates and assumptions<br />
The Group makes estimates and assumptions concerning the future. The resulting accounting estimates will, by definition, seldom equal the related<br />
actual results. The estimates and assumptions that have a significant risk of causing a material adjustment to the carrying amounts of assets and<br />
liabilities within the next financial year are disclosed below.<br />
(a) Assessment of the going concern (see note 2.1.1)<br />
(b)<br />
Estimate of fair value of investment properties<br />
The best evidence of fair value is current prices in an active market for similar assets. In the absence of such information, the Group determines the<br />
amount within a range of reasonable fair value estimates. In making its judgment, the Group considers information from a variety of sources including:<br />
- Current prices in an active market for properties of different nature, condition or location (or subject to different lease or other<br />
contracts), adjusted to reflect those differences;<br />
- Recent prices of similar properties in less active markets, with adjustments to reflect any changes in economic conditions since the<br />
date of the transactions that occurred at those prices; and<br />
- Discounted cash flow projections based on reliable estimates of future cash flows, derived from the terms of any existing lease and<br />
other contracts and (where possible) from external evidence such as current market rents for similar properties in the same location<br />
and condition, and using discount rates that reflect current market assessments of the uncertainty in the amount and timing of the<br />
cash flows.<br />
If information on current or recent prices is not available, the fair values of investment properties are determined using discounted cash flow valuation<br />
techniques. A cash flow period of 10 years is taken into consideration and is based on an estimate of the future potential net income generated by use<br />
of the properties. The Group uses assumptions that are mainly based on market conditions existing at each balance sheet date.<br />
ANNUAL CONSOLIDATED FINANCIAL STATEMENTS | 22