Weeks Bay Watershed Project Management Plan - Mobile Bay ...
Weeks Bay Watershed Project Management Plan - Mobile Bay ...
Weeks Bay Watershed Project Management Plan - Mobile Bay ...

Create successful ePaper yourself
Turn your PDF publications into a flip-book with our unique Google optimized e-Paper software.
24<br />
Typically, these nutrients control biological production in aquatic<br />
ecosystems. Excessive nutrient loading in marine and brackish<br />
ecosystems can reduce water clarity, result in algal blooms, and<br />
negatively affect aquatic grassbeds. Input of these nutrients occurs<br />
most commonly via stormwater runoff containing fertilizers, septic<br />
effluent, and plant and animal wastes. Fertilizers applied to lawns,<br />
row crops, sod farms, orchards and forest areas can be a significant<br />
source of nutrients.<br />
In a linkage model developed by Basnyat, et al. (1996) relating land<br />
use/land cover and nonpoint source (NPS) water pollution, the<br />
residential/urban areas in the <strong>Weeks</strong> <strong>Bay</strong> <strong>Watershed</strong> were identified<br />
as strong contributors of nitrate to streams. The second largest<br />
contributor was active agriculture. Modeling suggested that<br />
disturbances in areas close to or adjacent to streams have profound<br />
effects on water quality. Basnyat also suggested that forests act as a<br />
nitrate sink. As the proportion of forests inside the contributing area<br />
increases, nitrate concentrations decrease in receiving streams.<br />
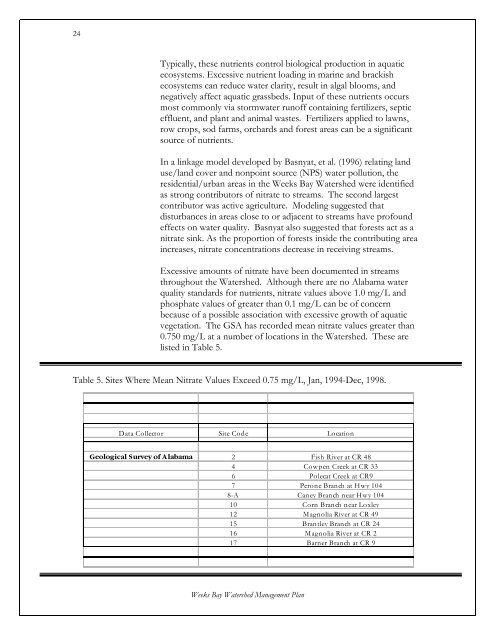
Excessive amounts of nitrate have been documented in streams<br />
throughout the <strong>Watershed</strong>. Although there are no Alabama water<br />
quality standards for nutrients, nitrate values above 1.0 mg/L and<br />
phosphate values of greater than 0.1 mg/L can be of concern<br />
because of a possible association with excessive growth of aquatic<br />
vegetation. The GSA has recorded mean nitrate values greater than<br />
0.750 mg/L at a number of locations in the <strong>Watershed</strong>. These are<br />
listed in Table 5.<br />
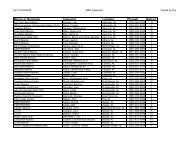
Table 5. Sites Where Mean Nitrate Values Exceed 0.75 mg/L, Jan, 1994-Dec, 1998.<br />
Data Collector Site Code Location<br />
Geological Survey of Alabama 2 Fish River at CR 48<br />
4 Cowpen Creek at CR 33<br />
6 Polecat Creek at CR9<br />
7 Perone Branch at Hwy 104<br />
8-A Caney Branch near Hwy 104<br />
10 Corn Branch near Loxley<br />
12 Magnolia River at CR 49<br />
15 Brantley Branch at CR 24<br />
16 Magnolia River at CR 2<br />
17 Barner Branch at CR 9<br />
<strong>Weeks</strong> <strong>Bay</strong> <strong>Watershed</strong> <strong>Management</strong> <strong>Plan</strong>