Dimensions and Design of swimming pool fences and balcony - ANEC
Dimensions and Design of swimming pool fences and balcony - ANEC
Dimensions and Design of swimming pool fences and balcony - ANEC

You also want an ePaper? Increase the reach of your titles
YUMPU automatically turns print PDFs into web optimized ePapers that Google loves.
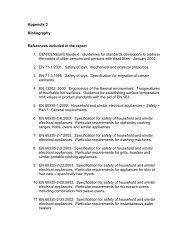
Percentage <strong>of</strong> crossings<br />
100%<br />
90%<br />
80%<br />
70%<br />
60%<br />
50%<br />
40%<br />
30%<br />
20%<br />
10%<br />
4,8 5,3<br />
10,7<br />
6,7<br />
3,6<br />
7,3<br />
4,3 4,2<br />
10,1<br />
5,3<br />
4,3<br />
25,0<br />
32,1<br />
29,3<br />
28,6<br />
89,5<br />
93,3<br />
85,1<br />
91,3<br />
70,8<br />
60,7<br />
63,4 64,3<br />
31-60 s<br />
21-30 s<br />
0-20 s<br />
0%<br />
G-3 H-3 I-3 J-3 K-3 L-3 M-3 N-3<br />
Barrier<br />
Figure 13 - Percentage <strong>of</strong> crossings according to different time categories in Group 3.<br />
4.3 Influence <strong>of</strong> morphological<br />
variables<br />
In order to determine the influence <strong>of</strong><br />
morphological variables in the action <strong>of</strong> crossing<br />
the barriers we analysed: i) the relationship<br />
between these variables <strong>and</strong> success in crossing,<br />
ii) the relationship between these variables <strong>and</strong><br />
time to cross.<br />
4.3.1 Relationship between morphological<br />
variables <strong>and</strong> success in crossing different<br />
barriers<br />
The comparison between the morphological<br />
characteristics <strong>of</strong> the group <strong>of</strong> children that<br />
crossed each barrier versus the group that<br />
couldn’t cross was only performed when both<br />
groups had at least 20 % <strong>of</strong> the total sample.<br />
For this reason, we excluded from analysis<br />
barriers F-2 (which only 10% <strong>of</strong> the children<br />
were able to cross), <strong>and</strong> G-3 <strong>and</strong> K-3 (which,<br />
respectively, only 16,3% <strong>and</strong> 4,7% <strong>of</strong> the children<br />
were not able to cross). We also excluded group<br />
1 from analysis due to the small success rate in<br />
that group.<br />
Data relative to the comparison <strong>of</strong> different<br />
morphological characteristics in children that<br />
failed versus children that succeeded in the<br />
action <strong>of</strong> crossing each barrier are shown in<br />
Tables 9 to 16. Table 17 summarizes the<br />
significant differences found for the barriers<br />
analysed in group 3.<br />
62<br />
Faculdade de Motricidade Humana<br />
Universidade Técnica de Lisboa