1 - paducah environmental information center
1 - paducah environmental information center
1 - paducah environmental information center

You also want an ePaper? Increase the reach of your titles
YUMPU automatically turns print PDFs into web optimized ePapers that Google loves.
Annual Site Environmental Report for 1999<br />
Appendix C: Data Tables<br />
Notes:<br />
L<br />
Selected results are discussed in the appropriate sections of the text of this report.<br />
2. "NO" . means the parameter was. not detected. Detection limits are available in the<br />
Paducah OREIS database.<br />
3. Monitoring programs often include measurement of extremely low concentrations of<br />
radionuclides, below the detection limit of the counting instruments. Less-than-detectable data<br />
. will produce numerical measurements with values below the detection limit and sometimes<br />
negative values. All of the actUal values, including those that are negative, are included in the<br />
statistical analyses in accordance with DOE's Environmental Regulatory Guide for<br />
Radiological Effluent Monitoring and Environmental Surveillance (DOE 1991).<br />
. -<br />
4. Average values are calculated using the actual result. values from the OREIS database,<br />
including when results are below the detection level. Where actual result values below the<br />
detection level are not available, the detection level is used in the calculations. Therefore,<br />
average values reported where any results used were below detection levels are actually lower<br />
than reported. ..<br />
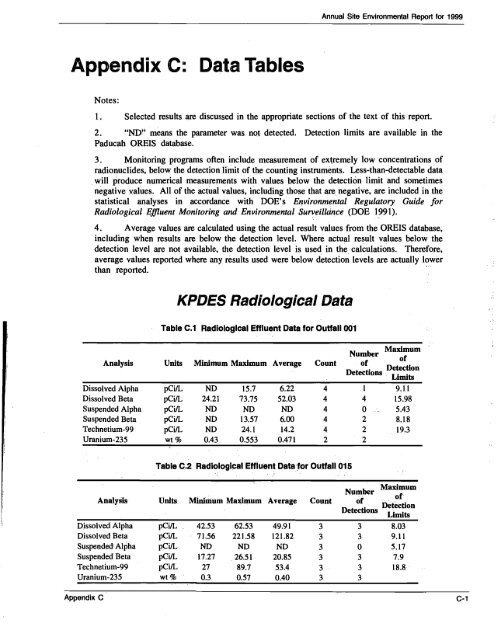
KPDES Radiological Data<br />
Table C.1 Radiological Effluent Data for Outfall 001<br />
Analysis Units Minimum Maximum Average Count<br />
Number Maximum<br />
of<br />
of<br />
Detection<br />
Detections<br />
Limits<br />
Dissolved Alpha pCiIL ND 15.7 6.22 4 9.11<br />
Dissolved Beta pCiIL 24.21 73.75 52.03 4 4 15.98<br />
Suspended Alpha pCiIL NO NO NO 4 0 5.43<br />
Suspended Beta pCiIL ND 13.57 6.00 4 2 8.18<br />
Technetium-99 pCiIL ND 24.1 14.2 4 2 19.3<br />
Uranium-235 wt% 0.43 0.553 0.471 2 2<br />
Table C.2 Radiological Effiuent Data ,for Outfall 015<br />
. . - ~. , . .<br />
Analysis Units Minimum Maximum Average Count<br />
Number Maximum<br />
of<br />
of<br />
Detection<br />
Detections<br />
Limits<br />
Dissolved; Alpha pCiIL 42.53 62.53 49.91 3 3 8.03<br />
Dissolved Beta pCiIL 71.56 221.58 121.82 3 3 9.11<br />
Suspended l Alpha pCiIL NO ND ND 3 0 5.17<br />
Suspended Beta pCiIL 17.27 26.51 20.85 3 3 7.9<br />
Technetium-99 pCilt 27 89.7 53.4 3 3 18.8<br />
Uranium-235 wt% 0.3 0.57 0.40 3 3<br />
Appendix C C-1