Final Report - Pima Association of Governments
Final Report - Pima Association of Governments
Final Report - Pima Association of Governments

Create successful ePaper yourself
Turn your PDF publications into a flip-book with our unique Google optimized e-Paper software.
High Capacity Transit System Plan - <strong>Final</strong> <strong>Report</strong> June 2009<br />
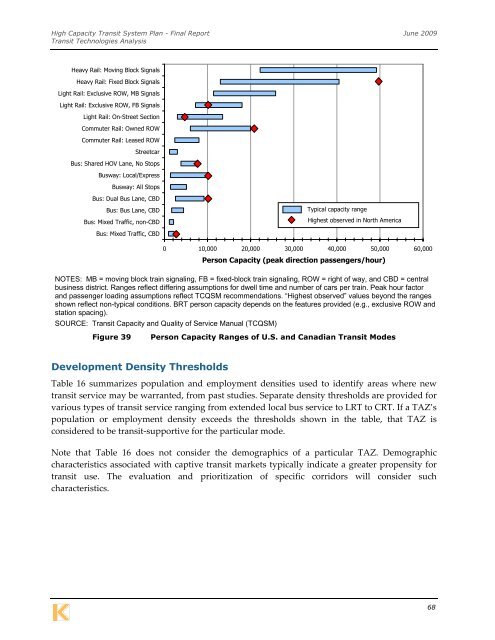
Transit Technologies Analysis<br />
Heavy Rail: Moving Block Signals<br />
Heavy Rail: Fixed Block Signals<br />
Light Rail: Exclusive ROW, MB Signals<br />
Light Rail: Exclusive ROW, FB Signals<br />
Light Rail: On-Street Section<br />
Commuter Rail: Owned ROW<br />
Commuter Rail: Leased ROW<br />
Streetcar<br />
Bus: Shared HOV Lane, No Stops<br />
Busway: Local/Express<br />
Busway: All Stops<br />
Bus: Dual Bus Lane, CBD<br />
Bus: Bus Lane, CBD<br />
Bus: Mixed Traffic, non-CBD<br />
Typical capacity range<br />
Highest observed in North America<br />
Bus: Mixed Traffic, CBD<br />
0 10,000 20,000 30,000 40,000 50,000 60,000<br />
Person Capacity (peak direction passengers/hour)<br />
NOTES: MB = moving block train signaling, FB = fixed-block train signaling, ROW = right <strong>of</strong> way, and CBD = central<br />
business district. Ranges reflect differing assumptions for dwell time and number <strong>of</strong> cars per train. Peak hour factor<br />
and passenger loading assumptions reflect TCQSM recommendations. “Highest observed” values beyond the ranges<br />
shown reflect non-typical conditions. BRT person capacity depends on the features provided (e.g., exclusive ROW and<br />
station spacing).<br />
SOURCE: Transit Capacity and Quality <strong>of</strong> Service Manual (TCQSM)<br />
Figure 39<br />
Person Capacity Ranges <strong>of</strong> U.S. and Canadian Transit Modes<br />
Development Density Thresholds<br />
Table 16 summarizes population and employment densities used to identify areas where new<br />
transit service may be warranted, from past studies. Separate density thresholds are provided for<br />
various types <strong>of</strong> transit service ranging from extended local bus service to LRT to CRT. If a TAZ’s<br />
population or employment density exceeds the thresholds shown in the table, that TAZ is<br />
considered to be transit‐supportive for the particular mode.<br />
Note that Table 16 does not consider the demographics <strong>of</strong> a particular TAZ. Demographic<br />
characteristics associated with captive transit markets typically indicate a greater propensity for<br />
transit use. The evaluation and prioritization <strong>of</strong> specific corridors will consider such<br />
characteristics.<br />
68