symbolic dynamic models for highly varying power system loads
symbolic dynamic models for highly varying power system loads
symbolic dynamic models for highly varying power system loads

Create successful ePaper yourself
Turn your PDF publications into a flip-book with our unique Google optimized e-Paper software.
101<br />
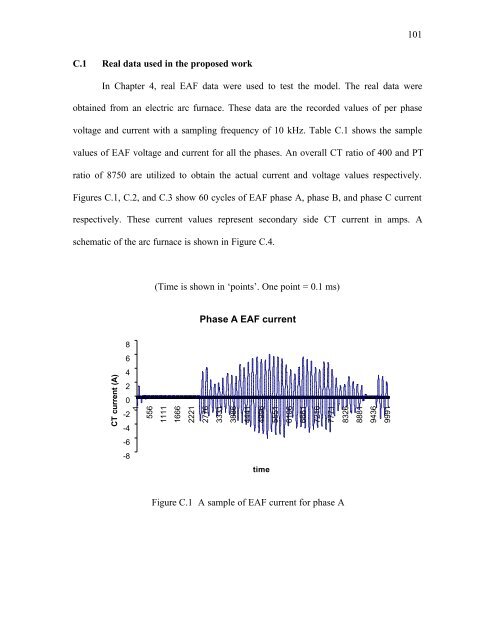
C.1 Real data used in the proposed work<br />
In Chapter 4, real EAF data were used to test the model. The real data were<br />
obtained from an electric arc furnace. These data are the recorded values of per phase<br />
voltage and current with a sampling frequency of 10 kHz. Table C.1 shows the sample<br />
values of EAF voltage and current <strong>for</strong> all the phases. An overall CT ratio of 400 and PT<br />
ratio of 8750 are utilized to obtain the actual current and voltage values respectively.<br />
Figures C.1, C.2, and C.3 show 60 cycles of EAF phase A, phase B, and phase C current<br />
respectively. These current values represent secondary side CT current in amps. A<br />
schematic of the arc furnace is shown in Figure C.4.<br />
(Time is shown in ‘points’. One point = 0.1 ms)<br />
Phase A EAF current<br />
8<br />
6<br />
CT current (A)<br />
4<br />
2<br />
0<br />
-2<br />
-4<br />
1<br />
556<br />
1111<br />
1666<br />
2221<br />
2776<br />
3331<br />
3886<br />
4441<br />
4996<br />
5551<br />
6106<br />
6661<br />
7216<br />
7771<br />
8326<br />
8881<br />
9436<br />
9991<br />
-6<br />
-8<br />
time<br />
Figure C.1 A sample of EAF current <strong>for</strong> phase A