symbolic dynamic models for highly varying power system loads
symbolic dynamic models for highly varying power system loads
symbolic dynamic models for highly varying power system loads

You also want an ePaper? Increase the reach of your titles
YUMPU automatically turns print PDFs into web optimized ePapers that Google loves.
48<br />
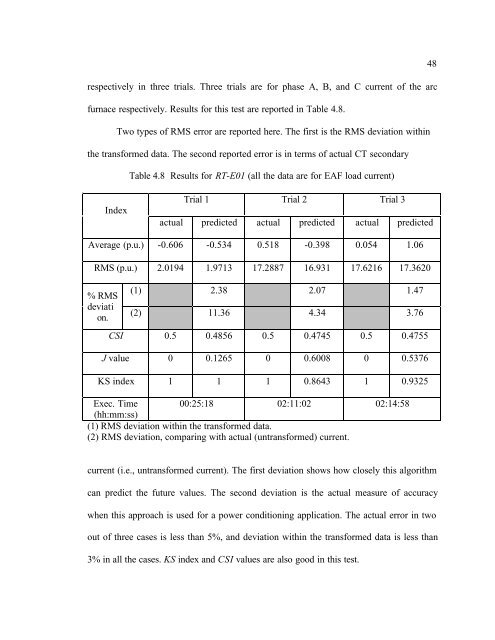
respectively in three trials. Three trials are <strong>for</strong> phase A, B, and C current of the arc<br />
furnace respectively. Results <strong>for</strong> this test are reported in Table 4.8.<br />
Two types of RMS error are reported here. The first is the RMS deviation within<br />
the trans<strong>for</strong>med data. The second reported error is in terms of actual CT secondary<br />
Table 4.8 Results <strong>for</strong> RT-E01 (all the data are <strong>for</strong> EAF load current)<br />
Index<br />
Trial 1 Trial 2 Trial 3<br />
actual predicted actual predicted actual predicted<br />
Average (p.u.) -0.606 -0.534 0.518 -0.398 0.054 1.06<br />
RMS (p.u.) 2.0194 1.9713 17.2887 16.931 17.6216 17.3620<br />
% RMS<br />
deviati<br />
on.<br />
(1) 2.38 2.07 1.47<br />
(2) 11.36 4.34 3.76<br />
CSI 0.5 0.4856 0.5 0.4745 0.5 0.4755<br />
J value 0 0.1265 0 0.6008 0 0.5376<br />
KS index 1 1 1 0.8643 1 0.9325<br />
Exec. Time 00:25:18 02:11:02 02:14:58<br />
(hh:mm:ss)<br />
(1) RMS deviation within the trans<strong>for</strong>med data.<br />
(2) RMS deviation, comparing with actual (untrans<strong>for</strong>med) current.<br />
current (i.e., untrans<strong>for</strong>med current). The first deviation shows how closely this algorithm<br />
can predict the future values. The second deviation is the actual measure of accuracy<br />
when this approach is used <strong>for</strong> a <strong>power</strong> conditioning application. The actual error in two<br />
out of three cases is less than 5%, and deviation within the trans<strong>for</strong>med data is less than<br />
3% in all the cases. KS index and CSI values are also good in this test.