symbolic dynamic models for highly varying power system loads
symbolic dynamic models for highly varying power system loads
symbolic dynamic models for highly varying power system loads

Create successful ePaper yourself
Turn your PDF publications into a flip-book with our unique Google optimized e-Paper software.
44<br />
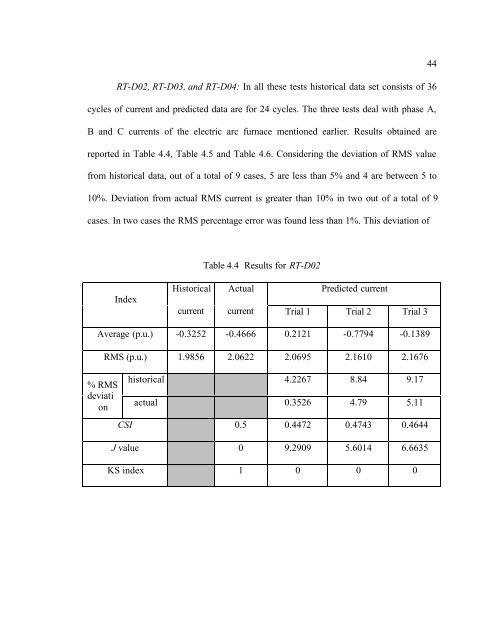
RT-D02, RT-D03, and RT-D04: In all these tests historical data set consists of 36<br />
cycles of current and predicted data are <strong>for</strong> 24 cycles. The three tests deal with phase A,<br />
B and C currents of the electric arc furnace mentioned earlier. Results obtained are<br />
reported in Table 4.4, Table 4.5 and Table 4.6. Considering the deviation of RMS value<br />
from historical data, out of a total of 9 cases, 5 are less than 5% and 4 are between 5 to<br />
10%. Deviation from actual RMS current is greater than 10% in two out of a total of 9<br />
cases. In two cases the RMS percentage error was found less than 1%. This deviation of<br />
Table 4.4 Results <strong>for</strong> RT-D02<br />
Index<br />
Historical<br />
current<br />
Actual<br />
Predicted current<br />
current Trial 1 Trial 2 Trial 3<br />
Average (p.u.) -0.3252 -0.4666 0.2121 -0.7794 -0.1389<br />
% RMS<br />
deviati<br />
on<br />
RMS (p.u.) 1.9856 2.0622 2.0695 2.1610 2.1676<br />
historical 4.2267 8.84 9.17<br />
actual 0.3526 4.79 5.11<br />
CSI 0.5 0.4472 0.4743 0.4644<br />
J value 0 9.2909 5.6014 6.6635<br />
KS index 1 0 0 0