symbolic dynamic models for highly varying power system loads
symbolic dynamic models for highly varying power system loads
symbolic dynamic models for highly varying power system loads

You also want an ePaper? Increase the reach of your titles
YUMPU automatically turns print PDFs into web optimized ePapers that Google loves.
46<br />
% of trials <strong>for</strong> which error<br />
is less than E<br />
100<br />
90<br />
80<br />
70<br />
60<br />
50<br />
40<br />
30<br />
20<br />
10<br />
0<br />
0.353 0.92 4.79 5.09 5.11 6.8 8.53 13.02 18.3<br />
% RMS error (E)<br />
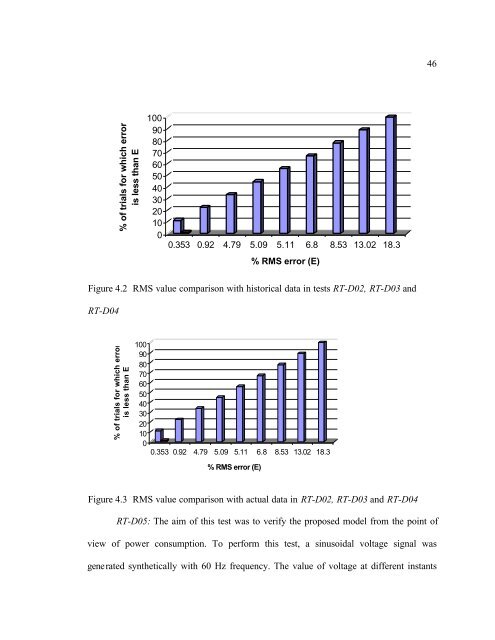
Figure 4.2 RMS value comparison with historical data in tests RT-D02, RT-D03 and<br />
RT-D04<br />
% of trials <strong>for</strong> which error<br />
is less than E<br />
100<br />
90<br />
80<br />
70<br />
60<br />
50<br />
40<br />
30<br />
20<br />
10<br />
0<br />
0.353 0.92 4.79 5.09 5.11 6.8 8.53 13.02 18.3<br />
% RMS error (E)<br />
Figure 4.3 RMS value comparison with actual data in RT-D02, RT-D03 and RT-D04<br />
RT-D05: The aim of this test was to verify the proposed model from the point of<br />
view of <strong>power</strong> consumption. To per<strong>for</strong>m this test, a sinusoidal voltage signal was<br />
generated synthetically with 60 Hz frequency. The value of voltage at different instants