Texas Instruments TI-34 MultiView? Scientific ... - Radio Shack
Texas Instruments TI-34 MultiView? Scientific ... - Radio Shack
Texas Instruments TI-34 MultiView? Scientific ... - Radio Shack

Create successful ePaper yourself
Turn your PDF publications into a flip-book with our unique Google optimized e-Paper software.
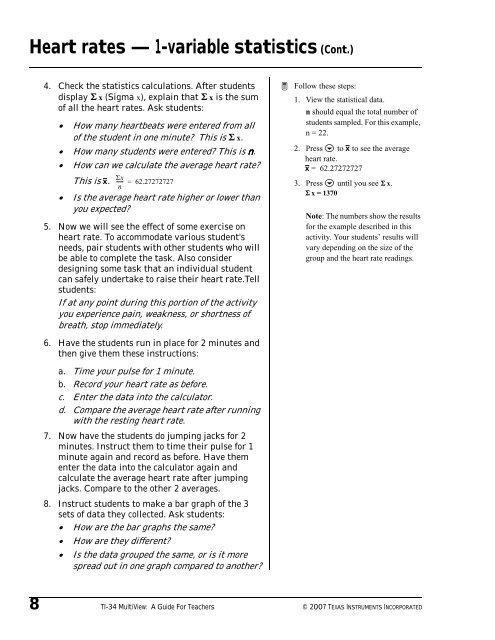
Heart rates — 1-variable statistics (Cont.)<br />
4. Check the statistics calculations. After students<br />
display Òx (Sigma x), explain that Òx is the sum<br />
of all the heart rates. Ask students:<br />
• How many heartbeats were entered from all<br />
of the student in one minute? This is Òx.<br />
• How many students were entered? This is n.<br />
• How can we calculate the average heart rate?<br />
This is Ï.<br />
Σx<br />
----- = 62.27272727<br />
n<br />
• Is the average heart rate higher or lower than<br />
you expected?<br />
5. Now we will see the effect of some exercise on<br />
heart rate. To accommodate various student's<br />
needs, pair students with other students who will<br />
be able to complete the task. Also consider<br />
designing some task that an individual student<br />
can safely undertake to raise their heart rate.Tell<br />
students:<br />
If at any point during this portion of the activity<br />
you experience pain, weakness, or shortness of<br />
breath, stop immediately.<br />
³ Follow these steps:<br />
1. View the statistical data.<br />
n should equal the total number of<br />
students sampled. For this example,<br />
n = 22.<br />
2. Press $ to Ï to see the average<br />
heart rate.<br />
Ï = 62.27272727<br />
3. Press $ until you see Òx.<br />
Òx = 1370<br />
Note: The numbers show the results<br />
for the example described in this<br />
activity. Your students’ results will<br />
vary depending on the size of the<br />
group and the heart rate readings.<br />
6. Have the students run in place for 2 minutes and<br />
then give them these instructions:<br />
a. Time your pulse for 1 minute.<br />
b. Record your heart rate as before.<br />
c. Enter the data into the calculator.<br />
d. Compare the average heart rate after running<br />
with the resting heart rate.<br />
7. Now have the students do jumping jacks for 2<br />
minutes. Instruct them to time their pulse for 1<br />
minute again and record as before. Have them<br />
enter the data into the calculator again and<br />
calculate the average heart rate after jumping<br />
jacks. Compare to the other 2 averages.<br />
8. Instruct students to make a bar graph of the 3<br />
sets of data they collected. Ask students:<br />
• How are the bar graphs the same?<br />
• How are they different?<br />
• Is the data grouped the same, or is it more<br />
spread out in one graph compared to another?<br />
8 <strong>TI</strong>-<strong>34</strong> <strong>MultiView</strong>: A Guide For Teachers © 2007 TEXAS INSTRUMENTS INCORPORATED