RTS200 RFID Test Set - RFID Webshop
RTS200 RFID Test Set - RFID Webshop
RTS200 RFID Test Set - RFID Webshop

Create successful ePaper yourself
Turn your PDF publications into a flip-book with our unique Google optimized e-Paper software.
GENERIC<br />
(The values TESPR1000 and TESPR1006_UHF are maintained for backward compatibility, but they<br />
correspond to the HTP100 and UTP100 antenna models respectively)<br />
Distance<br />
Tag-Antenna distance in mm. The value affects to the Magnetic Field magnitude to RF voltage<br />
correlation calculation<br />
The graphical display shows the waveform (time or frequency domains, depending on the settings<br />
or the selected test), and some additional information, as marker and cursor positions, or axis<br />
limits. It is possible to make some operations directly on the display:<br />
Operation<br />
Zoom<br />
Pan<br />
Full View<br />
Explanation<br />
Click on the top-left part of the area to be displayed, and drag to the bottom-right. The selected area will<br />
be adjusted to fit in the whole display zone<br />
Right click and drag on the display to the desired position<br />
Click and drag starting from the bottom-right and finishing in the top-left<br />
It is also possible to write values in the lower part of this screen section, in the Start, Stop and<br />
Centre fields.<br />
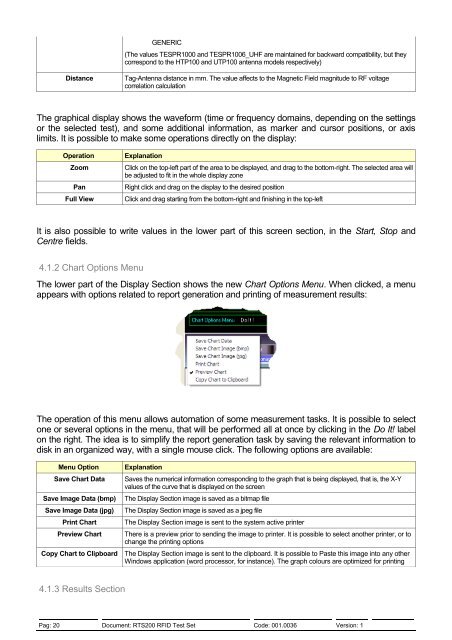
4.1.2 Chart Options Menu<br />
The lower part of the Display Section shows the new Chart Options Menu. When clicked, a menu<br />
appears with options related to report generation and printing of measurement results:<br />
The operation of this menu allows automation of some measurement tasks. It is possible to select<br />
one or several options in the menu, that will be performed all at once by clicking in the Do It! label<br />
on the right. The idea is to simplify the report generation task by saving the relevant information to<br />
disk in an organized way, with a single mouse click. The following options are available:<br />
Menu Option<br />
Save Chart Data<br />
Save Image Data (bmp)<br />
Save Image Data (jpg)<br />
Print Chart<br />
Preview Chart<br />
Copy Chart to Clipboard<br />
Explanation<br />
Saves the numerical information corresponding to the graph that is being displayed, that is, the X-Y<br />
values of the curve that is displayed on the screen<br />
The Display Section image is saved as a bitmap file<br />
The Display Section image is saved as a jpeg file<br />
The Display Section image is sent to the system active printer<br />
There is a preview prior to sending the image to printer. It is possible to select another printer, or to<br />
change the printing options<br />
The Display Section image is sent to the clipboard. It is possible to Paste this image into any other<br />
Windows application (word processor, for instance). The graph colours are optimized for printing<br />
4.1.3 Results Section<br />
Pag: 20 Document: <strong>RTS200</strong> <strong>RFID</strong> <strong>Test</strong> <strong>Set</strong> Code: 001.0036 Version: 1