Bicycle and Pedestrian Master Plan - sacog
Bicycle and Pedestrian Master Plan - sacog
Bicycle and Pedestrian Master Plan - sacog

You also want an ePaper? Increase the reach of your titles
YUMPU automatically turns print PDFs into web optimized ePapers that Google loves.
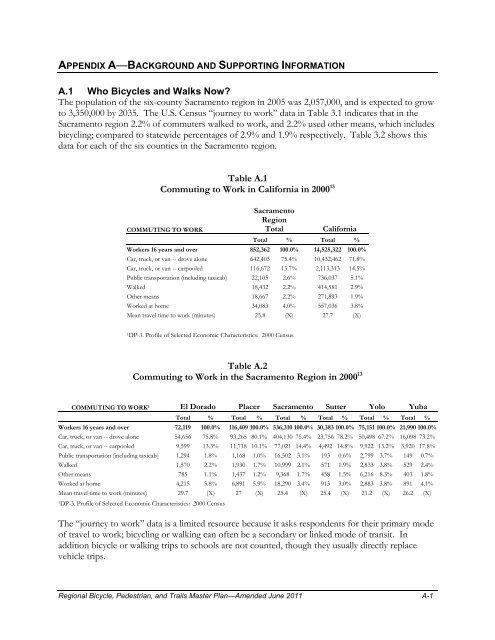
APPENDIX A—BACKGROUND AND SUPPORTING INFORMATION<br />
A.1 Who <strong>Bicycle</strong>s <strong>and</strong> Walks Now?<br />
The population of the six-county Sacramento region in 2005 was 2,057,000, <strong>and</strong> is expected to grow<br />
to 3,350,000 by 2035. The U.S. Census “journey to work” data in Table 3.1 indicates that in the<br />
Sacramento region 2.2% of commuters walked to work, <strong>and</strong> 2.2% used other means, which includes<br />
bicycling; compared to statewide percentages of 2.9% <strong>and</strong> 1.9% respectively. Table 3.2 shows this<br />
data for each of the six counties in the Sacramento region.<br />
Table A.1<br />
Commuting to Work in California in 2000 13<br />
COMMUTING TO WORK<br />
Sacramento<br />
Region<br />
Total<br />
California<br />
Total % Total %<br />
Workers 16 years <strong>and</strong> over 852,362 100.0% 14,525,322 100.0%<br />
Car, truck, or van -- drove alone 642,403 75.4% 10,432,462 71.8%<br />
Car, truck, or van -- carpooled 116,672 13.7% 2,113,313 14.5%<br />
Public transportation (including taxicab) 22,105 2.6% 736,037 5.1%<br />
Walked 18,432 2.2% 414,581 2.9%<br />
Other means 18,667 2.2% 271,893 1.9%<br />
Worked at home 34,083 4.0% 557,036 3.8%<br />
Mean travel time to work (minutes) 25.8 (X) 27.7 (X)<br />
1DP-3. Profile of Selected Economic Characteristics: 2000 Census<br />
Table A.2<br />
Commuting to Work in the Sacramento Region in 2000 13<br />
COMMUTING TO WORK 3 El Dorado Placer Sacramento Sutter Yolo Yuba<br />
Total % Total % Total % Total % Total % Total %<br />
Workers 16 years <strong>and</strong> over 72,119 100.0% 116,409 100.0% 536,310 100.0% 30,383 100.0% 75,151 100.0% 21,990 100.0%<br />
Car, truck, or van -- drove alone 54,656 75.8% 93,265 80.1% 404,130 75.4% 23,756 78.2% 50,498 67.2% 16,098 73.2%<br />
Car, truck, or van -- carpooled 9,599 13.3% 11,718 10.1% 77,021 14.4% 4,492 14.8% 9,922 13.2% 3,920 17.8%<br />
Public transportation (including taxicab) 1,294 1.8% 1,168 1.0% 16,502 3.1% 193 0.6% 2,799 3.7% 149 0.7%<br />
Walked 1,570 2.2% 1,930 1.7% 10,999 2.1% 571 1.9% 2,833 3.8% 529 2.4%<br />
Other means 785 1.1% 1,437 1.2% 9,368 1.7% 458 1.5% 6,216 8.3% 403 1.8%<br />
Worked at home 4,215 5.8% 6,891 5.9% 18,290 3.4% 913 3.0% 2,883 3.8% 891 4.1%<br />
Mean travel time to work (minutes) 29.7 (X) 27 (X) 25.4 (X) 25.4 (X) 21.2 (X) 26.2 (X)<br />
1DP-3. Profile of Selected Economic Characteristics: 2000 Census<br />
The “journey to work” data is a limited resource because it asks respondents for their primary mode<br />
of travel to work; bicycling or walking can often be a secondary or linked mode of transit. In<br />
addition bicycle or walking trips to schools are not counted, though they usually directly replace<br />
vehicle trips.<br />
Regional <strong>Bicycle</strong>, <strong>Pedestrian</strong>, <strong>and</strong> Trails <strong>Master</strong> <strong>Plan</strong>—Amended June 2011 A-1