

A Socio-Economic Profile of the Rufiji Floodplain and Delta.
A Socio-Economic Profile of the Rufiji Floodplain and Delta.
A Socio-Economic Profile of the Rufiji Floodplain and Delta.

Create successful ePaper yourself
Turn your PDF publications into a flip-book with our unique Google optimized e-Paper software.
<strong>Socio</strong>-economic pr<strong>of</strong>ile <strong>of</strong> <strong>Rufiji</strong> flood plain <strong>and</strong> <strong>Delta</strong> - Vol. 1<br />
AEZ<br />
Inner <strong>Delta</strong><br />
North<br />
Inner <strong>Delta</strong><br />
South<br />
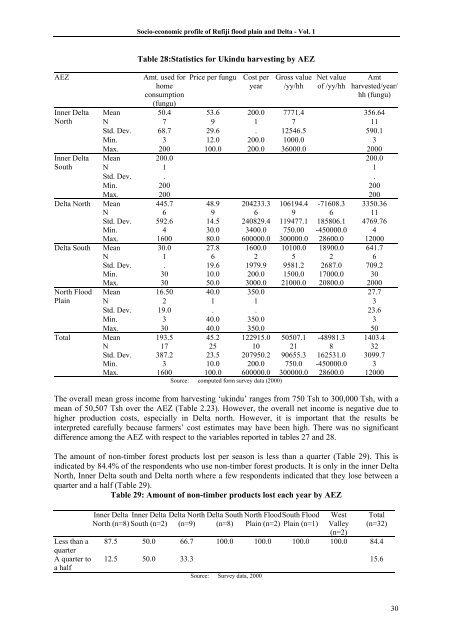
Table 28:Statistics for Ukindu harvesting by AEZ<br />
Amt. used for<br />
home<br />
consumption<br />
(fungu)<br />
Price per fungu<br />
Cost per<br />
year<br />
Gross value<br />
/yy/hh<br />
Net value<br />
<strong>of</strong> /yy/hh<br />
Amt<br />
harvested/year/<br />
hh (fungu)<br />
Mean 50.4 53.6 200.0 7771.4 356.64<br />
N 7 9 1 7 11<br />
Std. Dev. 68.7 29.6 . 12546.5 590.1<br />
Min. 3 12.0 200.0 1000.0 3<br />
Max. 200 100.0 200.0 36000.0 2000<br />
Mean 200.0 200.0<br />
N 1 1<br />
Std. Dev. . .<br />
Min. 200 200<br />
Max. 200 200<br />
<strong>Delta</strong> North Mean 445.7 48.9 204233.3 106194.4 -71608.3 3350.36<br />
N 6 9 6 9 6 11<br />
Std. Dev. 592.6 14.5 240829.4 119477.1 185806.1 4769.76<br />
Min. 4 30.0 3400.0 750.00 -450000.0 4<br />
Max. 1600 80.0 600000.0 300000.0 28600.0 12000<br />
<strong>Delta</strong> South Mean 30.0 27.8 1600.0 10100.0 18900.0 641.7<br />
N 1 6 2 5 2 6<br />
Std. Dev. . 19.6 1979.9 9581.2 2687.0 709.2<br />
Min. 30 10.0 200.0 1500.0 17000.0 30<br />
North Flood<br />
Plain<br />
Max. 30 50.0 3000.0 21000.0 20800.0 2000<br />
Mean 16.50 40.0 350.0 27.7<br />
N 2 1 1 3<br />
Std. Dev. 19.0 . . 23.6<br />
Min. 3 40.0 350.0 3<br />
Max. 30 40.0 350.0 50<br />
Total Mean 193.5 45.2 122915.0 50507.1 -48981.3 1403.4<br />
N 17 25 10 21 8 32<br />
Std. Dev. 387.2 23.5 207950.2 90655.3 162531.0 3099.7<br />
Min. 3 10.0 200.0 750.0 -450000.0 3<br />
Max. 1600 100.0 600000.0 300000.0 28600.0 12000<br />
Source: computed form survey data (2000)<br />
The overall mean gross income from harvesting ‘ukindu’ ranges from 750 Tsh to 300,000 Tsh, with a<br />
mean <strong>of</strong> 50,507 Tsh over <strong>the</strong> AEZ (Table 2.23). However, <strong>the</strong> overall net income is negative due to<br />
higher production costs, especially in <strong>Delta</strong> north. However, it is important that <strong>the</strong> results be<br />
interpreted carefully because farmers’ cost estimates may have been high. There was no significant<br />
difference among <strong>the</strong> AEZ with respect to <strong>the</strong> variables reported in tables 27 <strong>and</strong> 28.<br />
The amount <strong>of</strong> non-timber forest products lost per season is less than a quarter (Table 29). This is<br />
indicated by 84.4% <strong>of</strong> <strong>the</strong> respondents who use non-timber forest products. It is only in <strong>the</strong> inner <strong>Delta</strong><br />
North, Inner <strong>Delta</strong> south <strong>and</strong> <strong>Delta</strong> north where a few respondents indicated that <strong>the</strong>y lose between a<br />
quarter <strong>and</strong> a half (Table 29).<br />
Table 29: Amount <strong>of</strong> non-timber products lost each year by AEZ<br />
Less than a<br />
quarter<br />
A quarter to<br />
a half<br />
Inner <strong>Delta</strong> Inner <strong>Delta</strong><br />
North (n=8) South (n=2)<br />
<strong>Delta</strong> North<br />
(n=9)<br />
<strong>Delta</strong> South<br />
(n=8)<br />
North Flood South Flood<br />
Plain (n=2) Plain (n=1)<br />
West<br />
Valley<br />
(n=2)<br />
Total<br />
(n=32)<br />
87.5 50.0 66.7 100.0 100.0 100.0 100.0 84.4<br />
12.5 50.0 33.3 15.6<br />
Source: Survey data, 2000<br />
30


