A Socio-Economic Profile of the Rufiji Floodplain and Delta.
A Socio-Economic Profile of the Rufiji Floodplain and Delta.
A Socio-Economic Profile of the Rufiji Floodplain and Delta.
Create successful ePaper yourself
Turn your PDF publications into a flip-book with our unique Google optimized e-Paper software.
<strong>Socio</strong>-economic pr<strong>of</strong>ile <strong>of</strong> <strong>Rufiji</strong> flood plain <strong>and</strong> <strong>Delta</strong> - Vol. 1<br />
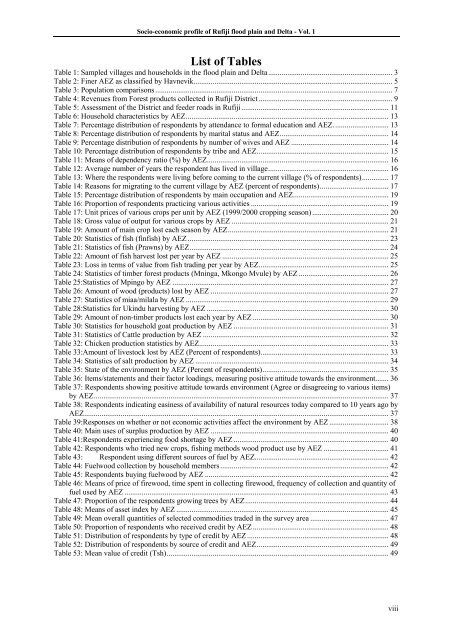
List <strong>of</strong> Tables<br />
Table 1: Sampled villages <strong>and</strong> households in <strong>the</strong> flood plain <strong>and</strong> <strong>Delta</strong>................................................................. 3<br />
Table 2: Finer AEZ as classified by Havnevik........................................................................................................ 5<br />
Table 3: Population comparisons............................................................................................................................ 7<br />
Table 4: Revenues from Forest products collected in <strong>Rufiji</strong> District ...................................................................... 9<br />
Table 5: Assessment <strong>of</strong> <strong>the</strong> District <strong>and</strong> feeder roads in <strong>Rufiji</strong>............................................................................. 11<br />
Table 6: Household characteristics by AEZ.......................................................................................................... 13<br />
Table 7: Percentage distribution <strong>of</strong> respondents by attendance to formal education <strong>and</strong> AEZ............................. 13<br />
Table 8: Percentage distribution <strong>of</strong> respondents by marital status <strong>and</strong> AEZ......................................................... 14<br />
Table 9: Percentage distribution <strong>of</strong> respondents by number <strong>of</strong> wives <strong>and</strong> AEZ ................................................... 14<br />
Table 10: Percentage distribution <strong>of</strong> respondents by tribe <strong>and</strong> AEZ..................................................................... 15<br />
Table 11: Means <strong>of</strong> dependency ratio (%) by AEZ............................................................................................... 16<br />
Table 12: Average number <strong>of</strong> years <strong>the</strong> respondent has lived in village............................................................... 16<br />
Table 13: Where <strong>the</strong> respondents were living before coming to <strong>the</strong> current village (% <strong>of</strong> respondents).............. 17<br />
Table 14: Reasons for migrating to <strong>the</strong> current village by AEZ (percent <strong>of</strong> respondents).................................... 17<br />
Table 15: Percentage distribution <strong>of</strong> respondents by main occupation <strong>and</strong> AEZ.................................................. 19<br />
Table 16: Proportion <strong>of</strong> respondents practicing various activities ........................................................................ 19<br />
Table 17: Unit prices <strong>of</strong> various crops per unit by AEZ (1999/2000 cropping season)........................................ 20<br />
Table 18: Gross value <strong>of</strong> output for various crops by AEZ .................................................................................. 21<br />
Table 19: Amount <strong>of</strong> main crop lost each season by AEZ.................................................................................... 21<br />
Table 20: Statistics <strong>of</strong> fish (finfish) by AEZ ......................................................................................................... 23<br />
Table 21: Statistics <strong>of</strong> fish (Prawns) by AEZ........................................................................................................ 24<br />
Table 22: Amount <strong>of</strong> fish harvest lost per year by AEZ ....................................................................................... 25<br />
Table 23: Loss in terms <strong>of</strong> value from fish trading per year by AEZ.................................................................... 25<br />
Table 24: Statistics <strong>of</strong> timber forest products (Mninga, Mkongo Mvule) by AEZ ............................................... 26<br />
Table 25:Statistics <strong>of</strong> Mpingo by AEZ ................................................................................................................. 27<br />
Table 26: Amount <strong>of</strong> wood (products) lost by AEZ ............................................................................................. 27<br />
Table 27: Statistics <strong>of</strong> miaa/milala by AEZ .......................................................................................................... 29<br />
Table 28:Statistics for Ukindu harvesting by AEZ ............................................................................................... 30<br />
Table 29: Amount <strong>of</strong> non-timber products lost each year by AEZ ....................................................................... 30<br />
Table 30: Statistics for household goat production by AEZ ................................................................................. 31<br />
Table 31: Statistics <strong>of</strong> Cattle production by AEZ ................................................................................................. 32<br />
Table 32: Chicken production statistics by AEZ................................................................................................... 33<br />
Table 33:Amount <strong>of</strong> livestock lost by AEZ (Percent <strong>of</strong> respondents)................................................................... 33<br />
Table 34: Statistics <strong>of</strong> salt production by AEZ ..................................................................................................... 34<br />
Table 35: State <strong>of</strong> <strong>the</strong> environment by AEZ (Percent <strong>of</strong> respondents).................................................................. 35<br />
Table 36: Items/statements <strong>and</strong> <strong>the</strong>ir factor loadings, measuring positive attitude towards <strong>the</strong> environment....... 36<br />
Table 37: Respondents showing positive attitude towards environment (Agree or disagreeing to various items)<br />
by AEZ.......................................................................................................................................................... 37<br />
Table 38: Respondents indicating easiness <strong>of</strong> availability <strong>of</strong> natural resources today compared to 10 years ago by<br />
AEZ............................................................................................................................................................... 37<br />
Table 39:Responses on whe<strong>the</strong>r or not economic activities affect <strong>the</strong> environment by AEZ ............................... 38<br />
Table 40: Main uses <strong>of</strong> surplus production by AEZ ............................................................................................. 40<br />
Table 41:Respondents experiencing food shortage by AEZ ................................................................................. 40<br />
Table 42: Respondents who tried new crops, fishing methods wood product use by AEZ .................................. 41<br />
Table 43: Respondent using different sources <strong>of</strong> fuel by AEZ...................................................................... 42<br />
Table 44: Fuelwood collection by household members........................................................................................ 42<br />
Table 45: Respondents buying fuelwood by AEZ ................................................................................................ 42<br />
Table 46: Means <strong>of</strong> price <strong>of</strong> firewood, time spent in collecting firewood, frequency <strong>of</strong> collection <strong>and</strong> quantity <strong>of</strong><br />
fuel used by AEZ .......................................................................................................................................... 43<br />
Table 47: Proportion <strong>of</strong> <strong>the</strong> respondents growing trees by AEZ........................................................................... 44<br />
Table 48: Means <strong>of</strong> asset index by AEZ ............................................................................................................... 45<br />
Table 49: Mean overall quantities <strong>of</strong> selected commodities traded in <strong>the</strong> survey area ......................................... 47<br />
Table 50: Proportion <strong>of</strong> respondents who received credit by AEZ ....................................................................... 48<br />
Table 51: Distribution <strong>of</strong> respondents by type <strong>of</strong> credit by AEZ .......................................................................... 48<br />
Table 52: Distribution <strong>of</strong> respondents by source <strong>of</strong> credit <strong>and</strong> AEZ..................................................................... 49<br />
Table 53: Mean value <strong>of</strong> credit (Tsh).................................................................................................................... 49<br />
viii


