

A Socio-Economic Profile of the Rufiji Floodplain and Delta.
A Socio-Economic Profile of the Rufiji Floodplain and Delta.
A Socio-Economic Profile of the Rufiji Floodplain and Delta.

You also want an ePaper? Increase the reach of your titles
YUMPU automatically turns print PDFs into web optimized ePapers that Google loves.
<strong>Socio</strong>-economic pr<strong>of</strong>ile <strong>of</strong> <strong>Rufiji</strong> flood plain <strong>and</strong> <strong>Delta</strong> - Vol. 1<br />
Table 30 shows that goat production is a high income earning enterprise giving an average annual net<br />
income <strong>of</strong> 236,350 Tsh. The results show fur<strong>the</strong>r that <strong>the</strong>re are no significant differences in <strong>the</strong><br />
statistics provided in table 30 across <strong>the</strong> AEZ.<br />
Cattle production<br />
Only four households out <strong>of</strong> <strong>the</strong> sampled 182 undertake cattle production. These households<br />
are from south <strong>Delta</strong> AEZ.<br />
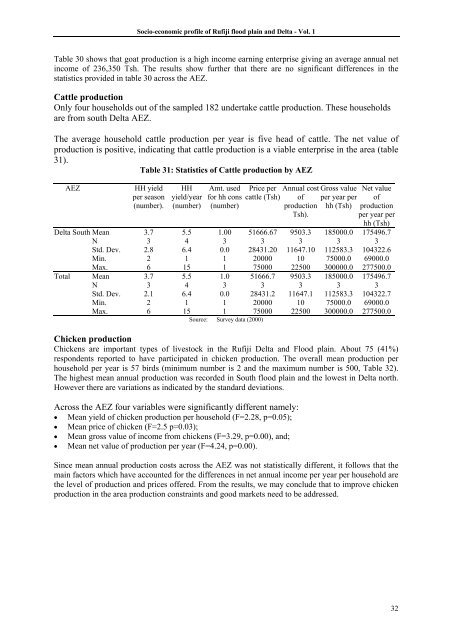
The average household cattle production per year is five head <strong>of</strong> cattle. The net value <strong>of</strong><br />
production is positive, indicating that cattle production is a viable enterprise in <strong>the</strong> area (table<br />
31).<br />
Table 31: Statistics <strong>of</strong> Cattle production by AEZ<br />
AEZ<br />
HH yield<br />
per season<br />
(number).<br />
HH<br />
yield/year<br />
(number)<br />
Amt. used<br />
for hh cons<br />
(number)<br />
Price per<br />
cattle (Tsh)<br />
Annual cost<br />
<strong>of</strong><br />
production<br />
Tsh).<br />
Gross value<br />
per year per<br />
hh (Tsh)<br />
Net value<br />
<strong>of</strong><br />
production<br />
per year per<br />
hh (Tsh)<br />
<strong>Delta</strong> South Mean 3.7 5.5 1.00 51666.67 9503.3 185000.0 175496.7<br />
N 3 4 3 3 3 3 3<br />
Std. Dev. 2.8 6.4 0.0 28431.20 11647.10 112583.3 104322.6<br />
Min. 2 1 1 20000 10 75000.0 69000.0<br />
Max. 6 15 1 75000 22500 300000.0 277500.0<br />
Total Mean 3.7 5.5 1.0 51666.7 9503.3 185000.0 175496.7<br />
N 3 4 3 3 3 3 3<br />
Std. Dev. 2.1 6.4 0.0 28431.2 11647.1 112583.3 104322.7<br />
Min. 2 1 1 20000 10 75000.0 69000.0<br />
Max. 6 15 1 75000 22500 300000.0 277500.0<br />
Source: Survey data (2000)<br />
Chicken production<br />
Chickens are important types <strong>of</strong> livestock in <strong>the</strong> <strong>Rufiji</strong> <strong>Delta</strong> <strong>and</strong> Flood plain. About 75 (41%)<br />
respondents reported to have participated in chicken production. The overall mean production per<br />
household per year is 57 birds (minimum number is 2 <strong>and</strong> <strong>the</strong> maximum number is 500, Table 32).<br />
The highest mean annual production was recorded in South flood plain <strong>and</strong> <strong>the</strong> lowest in <strong>Delta</strong> north.<br />
However <strong>the</strong>re are variations as indicated by <strong>the</strong> st<strong>and</strong>ard deviations.<br />
Across <strong>the</strong> AEZ four variables were significantly different namely:<br />
• Mean yield <strong>of</strong> chicken production per household (F=2.28, p=0.05);<br />
• Mean price <strong>of</strong> chicken (F=2.5 p=0.03);<br />
• Mean gross value <strong>of</strong> income from chickens (F=3.29, p=0.00), <strong>and</strong>;<br />
• Mean net value <strong>of</strong> production per year (F=4.24, p=0.00).<br />
Since mean annual production costs across <strong>the</strong> AEZ was not statistically different, it follows that <strong>the</strong><br />
main factors which have accounted for <strong>the</strong> differences in net annual income per year per household are<br />
<strong>the</strong> level <strong>of</strong> production <strong>and</strong> prices <strong>of</strong>fered. From <strong>the</strong> results, we may conclude that to improve chicken<br />
production in <strong>the</strong> area production constraints <strong>and</strong> good markets need to be addressed.<br />
32


