

A Socio-Economic Profile of the Rufiji Floodplain and Delta.
A Socio-Economic Profile of the Rufiji Floodplain and Delta.
A Socio-Economic Profile of the Rufiji Floodplain and Delta.

Create successful ePaper yourself
Turn your PDF publications into a flip-book with our unique Google optimized e-Paper software.
<strong>Socio</strong>-economic pr<strong>of</strong>ile <strong>of</strong> <strong>Rufiji</strong> flood plain <strong>and</strong> <strong>Delta</strong> - Vol. 1<br />
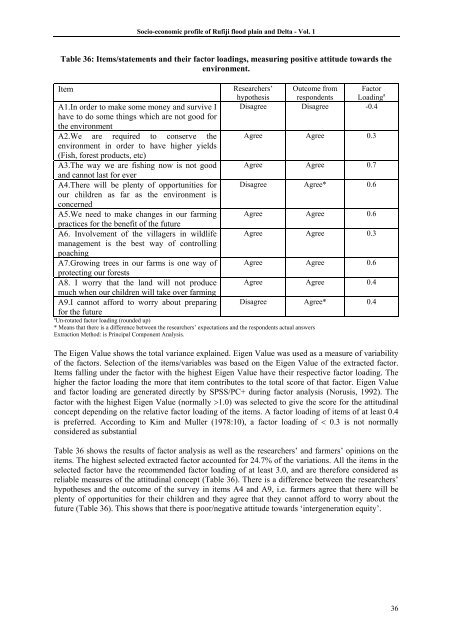
Table 36: Items/statements <strong>and</strong> <strong>the</strong>ir factor loadings, measuring positive attitude towards <strong>the</strong><br />
environment.<br />
Item<br />
A1.In order to make some money <strong>and</strong> survive I<br />
have to do some things which are not good for<br />
<strong>the</strong> environment<br />
A2.We are required to conserve <strong>the</strong><br />
environment in order to have higher yields<br />
(Fish, forest products, etc)<br />
A3.The way we are fishing now is not good<br />
<strong>and</strong> cannot last for ever<br />
A4.There will be plenty <strong>of</strong> opportunities for<br />
our children as far as <strong>the</strong> environment is<br />
concerned<br />
A5.We need to make changes in our farming<br />
practices for <strong>the</strong> benefit <strong>of</strong> <strong>the</strong> future<br />
A6. Involvement <strong>of</strong> <strong>the</strong> villagers in wildlife<br />
management is <strong>the</strong> best way <strong>of</strong> controlling<br />
poaching<br />
A7.Growing trees in our farms is one way <strong>of</strong><br />
protecting our forests<br />
A8. I worry that <strong>the</strong> l<strong>and</strong> will not produce<br />
much when our children will take over farming<br />
A9.I cannot afford to worry about preparing<br />
for <strong>the</strong> future<br />
Researchers’ Outcome from Factor<br />
hypo<strong>the</strong>sis respondents Loading a<br />
Disagree Disagree -0.4<br />
Agree Agree 0.3<br />
Agree Agree 0.7<br />
Disagree Agree* 0.6<br />
Agree Agree 0.6<br />
Agree Agree 0.3<br />
Agree Agree 0.6<br />
Agree Agree 0.4<br />
Disagree Agree* 0.4<br />
a Un-rotated factor loading (rounded up)<br />
* Means that <strong>the</strong>re is a difference between <strong>the</strong> researchers’ expectations <strong>and</strong> <strong>the</strong> respondents actual answers<br />
Extraction Method: is Principal Component Analysis.<br />
The Eigen Value shows <strong>the</strong> total variance explained. Eigen Value was used as a measure <strong>of</strong> variability<br />
<strong>of</strong> <strong>the</strong> factors. Selection <strong>of</strong> <strong>the</strong> items/variables was based on <strong>the</strong> Eigen Value <strong>of</strong> <strong>the</strong> extracted factor.<br />
Items falling under <strong>the</strong> factor with <strong>the</strong> highest Eigen Value have <strong>the</strong>ir respective factor loading. The<br />
higher <strong>the</strong> factor loading <strong>the</strong> more that item contributes to <strong>the</strong> total score <strong>of</strong> that factor. Eigen Value<br />
<strong>and</strong> factor loading are generated directly by SPSS/PC+ during factor analysis (Norusis, 1992). The<br />
factor with <strong>the</strong> highest Eigen Value (normally >1.0) was selected to give <strong>the</strong> score for <strong>the</strong> attitudinal<br />
concept depending on <strong>the</strong> relative factor loading <strong>of</strong> <strong>the</strong> items. A factor loading <strong>of</strong> items <strong>of</strong> at least 0.4<br />
is preferred. According to Kim <strong>and</strong> Muller (1978:10), a factor loading <strong>of</strong> < 0.3 is not normally<br />
considered as substantial<br />
Table 36 shows <strong>the</strong> results <strong>of</strong> factor analysis as well as <strong>the</strong> researchers’ <strong>and</strong> farmers’ opinions on <strong>the</strong><br />
items. The highest selected extracted factor accounted for 24.7% <strong>of</strong> <strong>the</strong> variations. All <strong>the</strong> items in <strong>the</strong><br />
selected factor have <strong>the</strong> recommended factor loading <strong>of</strong> at least 3.0, <strong>and</strong> are <strong>the</strong>refore considered as<br />
reliable measures <strong>of</strong> <strong>the</strong> attitudinal concept (Table 36). There is a difference between <strong>the</strong> researchers’<br />
hypo<strong>the</strong>ses <strong>and</strong> <strong>the</strong> outcome <strong>of</strong> <strong>the</strong> survey in items A4 <strong>and</strong> A9, i.e. farmers agree that <strong>the</strong>re will be<br />
plenty <strong>of</strong> opportunities for <strong>the</strong>ir children <strong>and</strong> <strong>the</strong>y agree that <strong>the</strong>y cannot afford to worry about <strong>the</strong><br />
future (Table 36). This shows that <strong>the</strong>re is poor/negative attitude towards ‘intergeneration equity’.<br />
36


