

A Socio-Economic Profile of the Rufiji Floodplain and Delta.
A Socio-Economic Profile of the Rufiji Floodplain and Delta.
A Socio-Economic Profile of the Rufiji Floodplain and Delta.

Create successful ePaper yourself
Turn your PDF publications into a flip-book with our unique Google optimized e-Paper software.
<strong>Socio</strong>-economic pr<strong>of</strong>ile <strong>of</strong> <strong>Rufiji</strong> flood plain <strong>and</strong> <strong>Delta</strong> - Vol. 1<br />
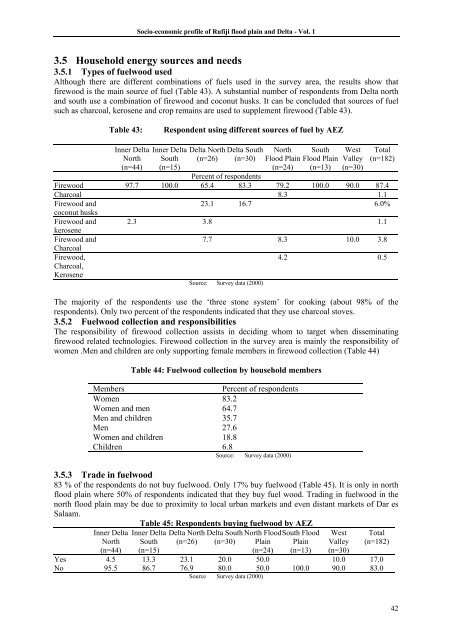
3.5 Household energy sources <strong>and</strong> needs<br />
3.5.1 Types <strong>of</strong> fuelwood used<br />
Although <strong>the</strong>re are different combinations <strong>of</strong> fuels used in <strong>the</strong> survey area, <strong>the</strong> results show that<br />
firewood is <strong>the</strong> main source <strong>of</strong> fuel (Table 43). A substantial number <strong>of</strong> respondents from <strong>Delta</strong> north<br />
<strong>and</strong> south use a combination <strong>of</strong> firewood <strong>and</strong> coconut husks. It can be concluded that sources <strong>of</strong> fuel<br />
such as charcoal, kerosene <strong>and</strong> crop remains are used to supplement firewood (Table 43).<br />
Table 43:<br />
Respondent using different sources <strong>of</strong> fuel by AEZ<br />
Inner <strong>Delta</strong><br />
North<br />
(n=44)<br />
Inner <strong>Delta</strong><br />
South<br />
(n=15)<br />
<strong>Delta</strong> North <strong>Delta</strong> South<br />
(n=26) (n=30)<br />
North<br />
Flood Plain<br />
(n=24)<br />
South<br />
Flood Plain<br />
(n=13)<br />
West<br />
Valley<br />
(n=30)<br />
Total<br />
(n=182)<br />
Percent <strong>of</strong> respondents<br />
Firewood 97.7 100.0 65.4 83.3 79.2 100.0 90.0 87.4<br />
Charcoal 8.3 1.1<br />
Firewood <strong>and</strong><br />
coconut husks<br />
Firewood <strong>and</strong><br />
kerosene<br />
Firewood <strong>and</strong><br />
Charcoal<br />
Firewood,<br />
Charcoal,<br />
Kerosene<br />
23.1 16.7 6.0%<br />
2.3 3.8 1.1<br />
7.7 8.3 10.0 3.8<br />
Source: Survey data (2000)<br />
4.2 0.5<br />
The majority <strong>of</strong> <strong>the</strong> respondents use <strong>the</strong> ‘three stone system’ for cooking (about 98% <strong>of</strong> <strong>the</strong><br />
respondents). Only two percent <strong>of</strong> <strong>the</strong> respondents indicated that <strong>the</strong>y use charcoal stoves.<br />
3.5.2 Fuelwood collection <strong>and</strong> responsibilities<br />
The responsibility <strong>of</strong> firewood collection assists in deciding whom to target when disseminating<br />
firewood related technologies. Firewood collection in <strong>the</strong> survey area is mainly <strong>the</strong> responsibility <strong>of</strong><br />
women .Men <strong>and</strong> children are only supporting female members in firewood collection (Table 44)<br />
Table 44: Fuelwood collection by household members<br />
Members<br />
Percent <strong>of</strong> respondents<br />
Women 83.2<br />
Women <strong>and</strong> men 64.7<br />
Men <strong>and</strong> children 35.7<br />
Men 27.6<br />
Women <strong>and</strong> children 18.8<br />
Children 6.8<br />
Source: Survey data (2000)<br />
3.5.3 Trade in fuelwood<br />
83 % <strong>of</strong> <strong>the</strong> respondents do not buy fuelwood. Only 17% buy fuelwood (Table 45). It is only in north<br />
flood plain where 50% <strong>of</strong> respondents indicated that <strong>the</strong>y buy fuel wood. Trading in fuelwood in <strong>the</strong><br />
north flood plain may be due to proximity to local urban markets <strong>and</strong> even distant markets <strong>of</strong> Dar es<br />
Salaam.<br />
Table 45: Respondents buying fuelwood by AEZ<br />
Inner <strong>Delta</strong><br />
North<br />
(n=44)<br />
Inner <strong>Delta</strong><br />
South<br />
(n=15)<br />
<strong>Delta</strong> North<br />
(n=26)<br />
<strong>Delta</strong> South<br />
(n=30)<br />
North Flood<br />
Plain<br />
(n=24)<br />
South Flood<br />
Plain<br />
(n=13)<br />
West<br />
Valley<br />
(n=30)<br />
Total<br />
(n=182)<br />
Yes 4.5 13.3 23.1 20.0 50.0 10.0 17.0<br />
No 95.5 86.7 76.9 80.0 50.0 100.0 90.0 83.0<br />
Source Survey data (2000)<br />
42


