North Northamptonshire Annual Monitoring Report 2010-11
North Northamptonshire Annual Monitoring Report 2010-11
North Northamptonshire Annual Monitoring Report 2010-11

Create successful ePaper yourself
Turn your PDF publications into a flip-book with our unique Google optimized e-Paper software.
101<br />
ECONOMY<br />
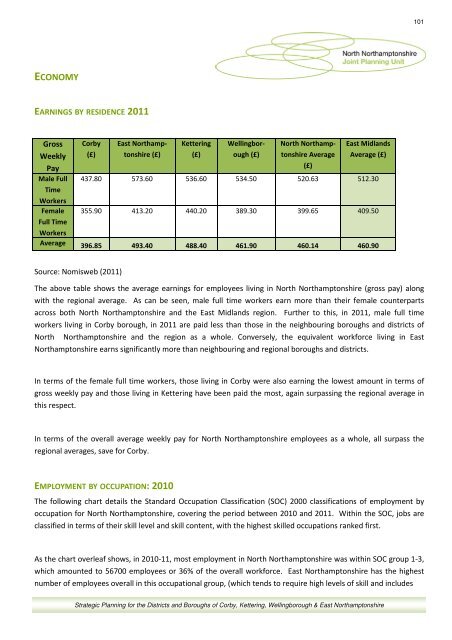
EARNINGS BY RESIDENCE 20<strong>11</strong><br />
Gross<br />
Weekly<br />
Corby<br />
(£)<br />
East <strong>North</strong>amptonshire<br />
(£)<br />
Kettering<br />
(£)<br />
Wellingborough<br />
(£)<br />
<strong>North</strong> <strong>North</strong>amptonshire<br />
Average<br />
East Midlands<br />
Average (£)<br />
Pay<br />
(£)<br />
Male Full 437.80 573.60 536.60 534.50 520.63 512.30<br />
Time<br />
Workers<br />
Female 355.90 413.20 440.20 389.30 399.65 409.50<br />
Full Time<br />
Workers<br />
Average 396.85 493.40 488.40 461.90 460.14 460.90<br />
Source: Nomisweb (20<strong>11</strong>)<br />
The above table shows the average earnings for employees living in <strong>North</strong> <strong>North</strong>amptonshire (gross pay) along<br />
with the regional average. As can be seen, male full time workers earn more than their female counterparts<br />
across both <strong>North</strong> <strong>North</strong>amptonshire and the East Midlands region. Further to this, in 20<strong>11</strong>, male full time<br />
workers living in Corby borough, in 20<strong>11</strong> are paid less than those in the neighbouring boroughs and districts of<br />
<strong>North</strong> <strong>North</strong>amptonshire and the region as a whole. Conversely, the equivalent workforce living in East<br />
<strong>North</strong>amptonshire earns significantly more than neighbouring and regional boroughs and districts.<br />
In terms of the female full time workers, those living in Corby were also earning the lowest amount in terms of<br />
gross weekly pay and those living in Kettering have been paid the most, again surpassing the regional average in<br />
this respect.<br />
In terms of the overall average weekly pay for <strong>North</strong> <strong>North</strong>amptonshire employees as a whole, all surpass the<br />
regional averages, save for Corby.<br />
EMPLOYMENT BY OCCUPATION: <strong>2010</strong><br />
The following chart details the Standard Occupation Classification (SOC) 2000 classifications of employment by<br />
occupation for <strong>North</strong> <strong>North</strong>amptonshire, covering the period between <strong>2010</strong> and 20<strong>11</strong>. Within the SOC, jobs are<br />
classified in terms of their skill level and skill content, with the highest skilled occupations ranked first.<br />
As the chart overleaf shows, in <strong>2010</strong>-<strong>11</strong>, most employment in <strong>North</strong> <strong>North</strong>amptonshire was within SOC group 1-3,<br />
which amounted to 56700 employees or 36% of the overall workforce. East <strong>North</strong>amptonshire has the highest<br />
number of employees overall in this occupational group, (which tends to require high levels of skill and includes<br />
Strategic Planning for the Districts and Boroughs of Corby, Kettering, Wellingborough & East <strong>North</strong>amptonshire