North Northamptonshire Annual Monitoring Report 2010-11
North Northamptonshire Annual Monitoring Report 2010-11
North Northamptonshire Annual Monitoring Report 2010-11

You also want an ePaper? Increase the reach of your titles
YUMPU automatically turns print PDFs into web optimized ePapers that Google loves.
93<br />
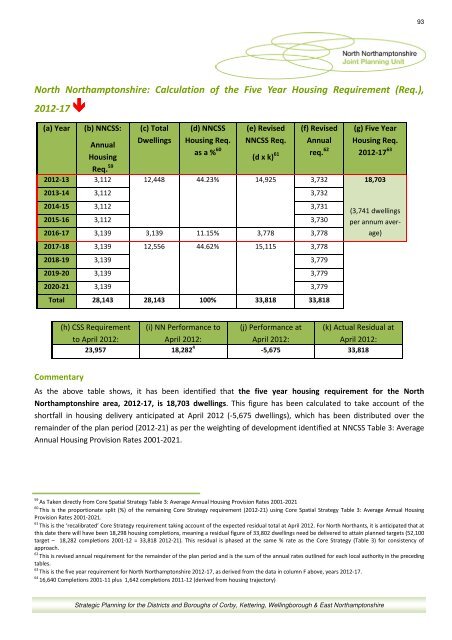
<strong>North</strong> <strong>North</strong>amptonshire: Calculation of the Five Year Housing Requirement (Req.),<br />
2012-17 <br />
(a) Year<br />
(b) NNCSS:<br />
(c) Total<br />
(d) NNCSS<br />
(e) Revised<br />
Dwellings Housing Req. NNCSS Req. <strong>Annual</strong> Housing Req.<br />
<strong>Annual</strong><br />
as a % 60<br />
req. 62 2012-17 63<br />
Housing<br />
Req. 59<br />
2012-13 3,<strong>11</strong>2 12,448 44.23% 14,925 3,732 18,703<br />
(d x k) 61 (f) Revised<br />
2013-14 3,<strong>11</strong>2 3,732<br />
2014-15 3,<strong>11</strong>2 3,731<br />
2015-16 3,<strong>11</strong>2 3,730<br />
2016-17 3,139 3,139 <strong>11</strong>.15% 3,778 3,778<br />
2017-18 3,139 12,556 44.62% 15,<strong>11</strong>5 3,778<br />
2018-19 3,139 3,779<br />
2019-20 3,139 3,779<br />
2020-21 3,139 3,779<br />
Total 28,143 28,143 100% 33,818 33,818<br />
(g) Five Year<br />
(3,741 dwellings<br />
per annum average)<br />
(h) CSS Requirement (i) NN Performance to (j) Performance at (k) Actual Residual at<br />
to April 2012:<br />
April 2012:<br />
April 2012:<br />
April 2012:<br />
23,957 18,282 4 -5,675 33,818<br />
Commentary<br />
As the above table shows, it has been identified that the five year housing requirement for the <strong>North</strong><br />
<strong>North</strong>amptonshire area, 2012-17, is 18,703 dwellings. This figure has been calculated to take account of the<br />
shortfall in housing delivery anticipated at April 2012 (-5,675 dwellings), which has been distributed over the<br />
remainder of the plan period (2012-21) as per the weighting of development identified at NNCSS Table 3: Average<br />
<strong>Annual</strong> Housing Provision Rates 2001-2021.<br />
59<br />
As Taken directly from Core Spatial Strategy Table 3: Average <strong>Annual</strong> Housing Provision Rates 2001-2021<br />
60<br />
This is the proportionate split (%) of the remaining Core Strategy requirement (2012-21) using Core Spatial Strategy Table 3: Average <strong>Annual</strong> Housing<br />
Provision Rates 2001-2021.<br />
61<br />
This is the ‘recalibrated’ Core Strategy requirement taking account of the expected residual total at April 2012. For <strong>North</strong> <strong>North</strong>ants, it is anticipated that at<br />
this date there will have been 18,298 housing completions, meaning a residual figure of 33,802 dwellings need be delivered to attain planned targets (52,100<br />
target – 18,282 completions 2001-12 = 33,818 2012-21). This residual is phased at the same % rate as the Core Strategy (Table 3) for consistency of<br />
approach.<br />
62<br />
This is revised annual requirement for the remainder of the plan period and is the sum of the annual rates outlined for each local authority in the preceding<br />
tables.<br />
63<br />
This is the five year requirement for <strong>North</strong> <strong>North</strong>amptonshire 2012-17, as derived from the data in column F above, years 2012-17.<br />
64<br />
16,640 Completions 2001-<strong>11</strong> plus 1,642 completions 20<strong>11</strong>-12 (derived from housing trajectory)<br />
Strategic Planning for the Districts and Boroughs of Corby, Kettering, Wellingborough & East <strong>North</strong>amptonshire