North Northamptonshire Annual Monitoring Report 2010-11
North Northamptonshire Annual Monitoring Report 2010-11
North Northamptonshire Annual Monitoring Report 2010-11

You also want an ePaper? Increase the reach of your titles
YUMPU automatically turns print PDFs into web optimized ePapers that Google loves.
<strong>11</strong>1<br />
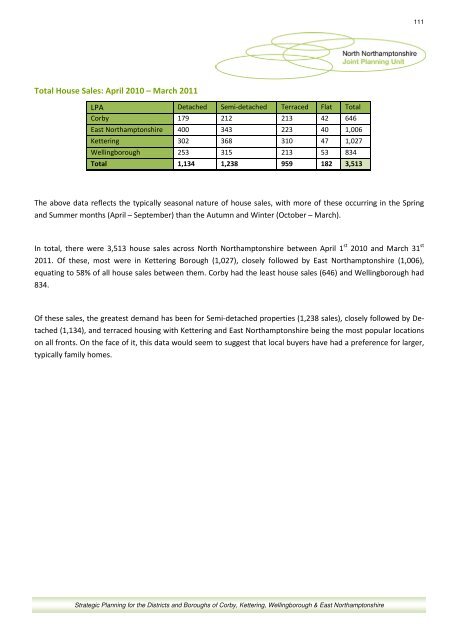
Total House Sales: April <strong>2010</strong> – March 20<strong>11</strong><br />
LPA Detached Semi-detached Terraced Flat Total<br />
Corby 179 212 213 42 646<br />
East <strong>North</strong>amptonshire 400 343 223 40 1,006<br />
Kettering 302 368 310 47 1,027<br />
Wellingborough 253 315 213 53 834<br />
Total 1,134 1,238 959 182 3,513<br />
The above data reflects the typically seasonal nature of house sales, with more of these occurring in the Spring<br />
and Summer months (April – September) than the Autumn and Winter (October – March).<br />
In total, there were 3,513 house sales across <strong>North</strong> <strong>North</strong>amptonshire between April 1 st <strong>2010</strong> and March 31 st<br />
20<strong>11</strong>. Of these, most were in Kettering Borough (1,027), closely followed by East <strong>North</strong>amptonshire (1,006),<br />
equating to 58% of all house sales between them. Corby had the least house sales (646) and Wellingborough had<br />
834.<br />
Of these sales, the greatest demand has been for Semi-detached properties (1,238 sales), closely followed by Detached<br />
(1,134), and terraced housing with Kettering and East <strong>North</strong>amptonshire being the most popular locations<br />
on all fronts. On the face of it, this data would seem to suggest that local buyers have had a preference for larger,<br />
typically family homes.<br />
Strategic Planning for the Districts and Boroughs of Corby, Kettering, Wellingborough & East <strong>North</strong>amptonshire