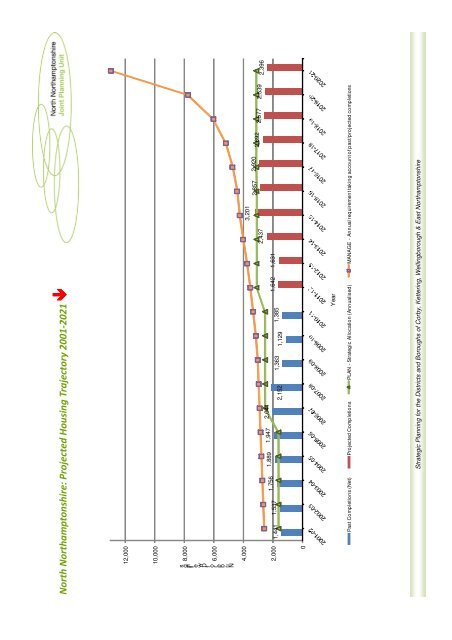
32 COI H2d: Managed Delivery Target 2012/ 13 H2d 2013/ 14 H2d 2014/ 15 H2d 2015/ 16 H2d 2016/ 17 H2d 2017/ 18 H2d 2018/ 19 H2d 2019/ 20 H2d 2020/ 21 H2d Corby 1,350 1,449 1,501 1,536 1,654 1,803 2,076 2,541 3,966 East <strong>North</strong>amptonshire 521 550 572 568 572 587 663 871 1,569 Kettering 816 849 890 890 918 977 1,077 1,358 2,136 Wellingborough 1,071 1,175 1,287 1,431 1,595 1,826 2,2<strong>11</strong> 2,982 5,293 <strong>North</strong> <strong>North</strong>amptonshire 3,758 4,023 4,250 4,425 4,739 5,193 6,027 7,752 12,964 The ‘Managed Delivery 17 figures presented above represent the net additional dwellings required to come forward each year, over the remaining plan period, to meet the NNCSS housing target. These figures take into account actual and projected delivery shortfalls in both previous and future years and represent the number of housing completions needed to get the plan back on track at any point in time. The value of this data is that it allows assessment of whether past shortfalls will be addressed through future trends in housing supply or whether there is any need for action to facilitate delivery of the strategic allocation. The managed delivery figures are calculated using a residual method and are derived from the total plan allocation less the cumulative rate of completions divided by the number of years a plan has left to run. As outlined in the preceding commentary, <strong>North</strong> <strong>North</strong>amptonshire does not have enough housing sites identified to deliver the plan targets to 2021. This has the effect of causing the ‘Manage’ calculation to increase annually over the remainder of the plan period and is in sharp contrast to the 2009 AMR where a perceived oversupply of sites, relevant to targets, facilitated a steady drop in these figures (which are replicated in the individual and <strong>North</strong> <strong>North</strong>amptonshire housing trajectories over upcoming pages/sections). To address this trend, more sites need be identified to counter the current shortfall in supply, which is currently made difficult by the prevailing economic climate. This situation will be addressed through an update to the 2009 SHLAA and the subsequent identification of additional housing sites through the NNCSS review and through site specific plans produced by the districts. In particular, the NNCSS review will use updated housing market information to set more appropriate levels of growth for the area. The data in Tables COI H1 to H2d above is represented in a housing trajectory produced for the area overleaf. 17 This data has been prepared in accordance with the guidance, and examples, presented in the DCLG Guidance Growth Fund – Programme of Development Guidance 2008: Annex B – Guidance on Producing Housing Trajectories (DCLG, 2008) Available from: http://www.communities.gov.uk/documents/housing/pdf/growthfundannexb.pdf Strategic Planning for the Districts and Boroughs of Corby, Kettering, Wellingborough & East <strong>North</strong>amptonshire
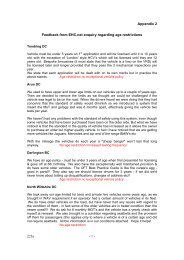
<strong>North</strong> <strong>North</strong>amptonshire: Projected Housing Trajectory 2001-2021 12,000 10,000 s g lin e w D f o r e ,b u N 8,000 6,000 4,000 2,000 3,201 2,857 2,920 2,692 2,437 2,577 2,539 2,396 1,756 1,889 1,947 2,041 1,441 1,537 1,642 1,631 2,152 1,363 1,385 1,129 0 Year Past Completions (Net) Projected Completions PLAN - Strategic Allocation (<strong>Annual</strong>ised) MANAGE - <strong>Annual</strong> requirement taking account of past/projected completions Strategic Planning for the Districts and Boroughs of Corby, Kettering, Wellingborough & East <strong>North</strong>amptonshire