North Northamptonshire Annual Monitoring Report 2010-11
North Northamptonshire Annual Monitoring Report 2010-11
North Northamptonshire Annual Monitoring Report 2010-11

You also want an ePaper? Increase the reach of your titles
YUMPU automatically turns print PDFs into web optimized ePapers that Google loves.
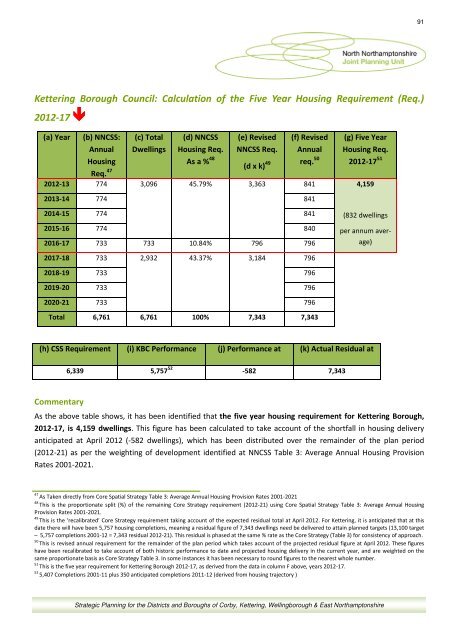
91<br />
Kettering Borough Council: Calculation of the Five Year Housing Requirement (Req.)<br />
2012-17 <br />
(a) Year<br />
(b) NNCSS:<br />
(c) Total<br />
(d) NNCSS<br />
(e) Revised<br />
<strong>Annual</strong><br />
Housing<br />
Req. 47<br />
Dwellings Housing Req.<br />
As a % 48<br />
NNCSS Req. <strong>Annual</strong><br />
req. 50<br />
Housing Req.<br />
2012-17 51<br />
2012-13 774 3,096 45.79% 3,363 841 4,159<br />
(d x k) 49 (f) Revised<br />
2013-14 774 841<br />
(g) Five Year<br />
2014-15 774 841<br />
2015-16 774 840<br />
2016-17 733 733 10.84% 796 796<br />
(832 dwellings<br />
per annum average)<br />
2017-18 733 2,932 43.37% 3,184 796<br />
2018-19 733 796<br />
2019-20 733 796<br />
2020-21 733 796<br />
Total 6,761 6,761 100% 7,343 7,343<br />
(h) CSS Requirement (i) KBC Performance (j) Performance at (k) Actual Residual at<br />
6,339 5,757 52 -582 7,343<br />
Commentary<br />
As the above table shows, it has been identified that the five year housing requirement for Kettering Borough,<br />
2012-17, is 4,159 dwellings. This figure has been calculated to take account of the shortfall in housing delivery<br />
anticipated at April 2012 (-582 dwellings), which has been distributed over the remainder of the plan period<br />
(2012-21) as per the weighting of development identified at NNCSS Table 3: Average <strong>Annual</strong> Housing Provision<br />
Rates 2001-2021.<br />
47<br />
As Taken directly from Core Spatial Strategy Table 3: Average <strong>Annual</strong> Housing Provision Rates 2001-2021<br />
48<br />
This is the proportionate split (%) of the remaining Core Strategy requirement (2012-21) using Core Spatial Strategy Table 3: Average <strong>Annual</strong> Housing<br />
Provision Rates 2001-2021.<br />
49<br />
This is the ‘recalibrated’ Core Strategy requirement taking account of the expected residual total at April 2012. For Kettering, it is anticipated that at this<br />
date there will have been 5,757 housing completions, meaning a residual figure of 7,343 dwellings need be delivered to attain planned targets (13,100 target<br />
– 5,757 completions 2001-12 = 7,343 residual 2012-21). This residual is phased at the same % rate as the Core Strategy (Table 3) for consistency of approach.<br />
50<br />
This is revised annual requirement for the remainder of the plan period which takes account of the projected residual figure at April 2012. These figures<br />
have been recalibrated to take account of both historic performance to date and projected housing delivery in the current year, and are weighted on the<br />
same proportionate basis as Core Strategy Table 3. In some instances it has been necessary to round figures to the nearest whole number.<br />
51<br />
This is the five year requirement for Kettering Borough 2012-17, as derived from the data in column F above, years 2012-17.<br />
52<br />
5,407 Completions 2001-<strong>11</strong> plus 350 anticipated completions 20<strong>11</strong>-12 (derived from housing trajectory )<br />
Strategic Planning for the Districts and Boroughs of Corby, Kettering, Wellingborough & East <strong>North</strong>amptonshire