North Northamptonshire Annual Monitoring Report 2010-11
North Northamptonshire Annual Monitoring Report 2010-11
North Northamptonshire Annual Monitoring Report 2010-11

You also want an ePaper? Increase the reach of your titles
YUMPU automatically turns print PDFs into web optimized ePapers that Google loves.
108<br />
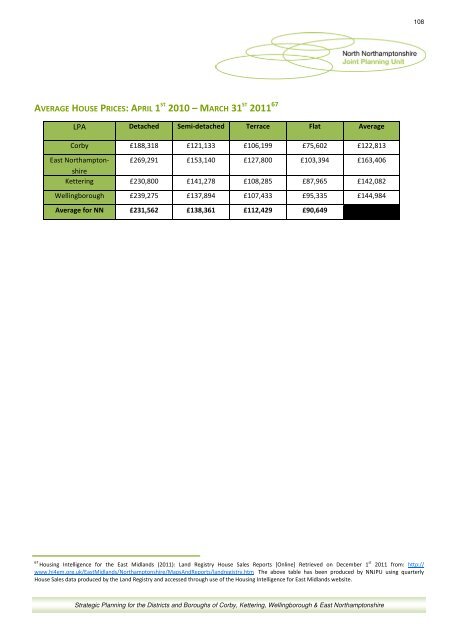
AVERAGE HOUSE PRICES: APRIL 1 ST <strong>2010</strong> – MARCH 31 ST 20<strong>11</strong> 67<br />
LPA Detached Semi-detached Terrace Flat Average<br />
Corby £188,318 £121,133 £106,199 £75,602 £122,813<br />
East <strong>North</strong>amptonshire<br />
£269,291 £153,140 £127,800 £103,394 £163,406<br />
Kettering £230,800 £141,278 £108,285 £87,965 £142,082<br />
Wellingborough £239,275 £137,894 £107,433 £95,335 £144,984<br />
Average for NN £231,562 £138,361 £<strong>11</strong>2,429 £90,649<br />
67<br />
Housing Intelligence for the East Midlands (20<strong>11</strong>): Land Registry House Sales <strong>Report</strong>s [Online] Retrieved on December 1 st 20<strong>11</strong> from: http://<br />
www.hi4em.org.uk/EastMidlands/<strong>North</strong>amptonshire/MapsAnd<strong>Report</strong>s/landregistry.htm The above table has been produced by NNJPU using quarterly<br />
House Sales data produced by the Land Registry and accessed through use of the Housing Intelligence for East Midlands website.<br />
Strategic Planning for the Districts and Boroughs of Corby, Kettering, Wellingborough & East <strong>North</strong>amptonshire