North Northamptonshire Annual Monitoring Report 2010-11
North Northamptonshire Annual Monitoring Report 2010-11
North Northamptonshire Annual Monitoring Report 2010-11

You also want an ePaper? Increase the reach of your titles
YUMPU automatically turns print PDFs into web optimized ePapers that Google loves.
3. O<br />
3. OVERALL<br />
SPATIAL<br />
STRATEGY<br />
18<br />
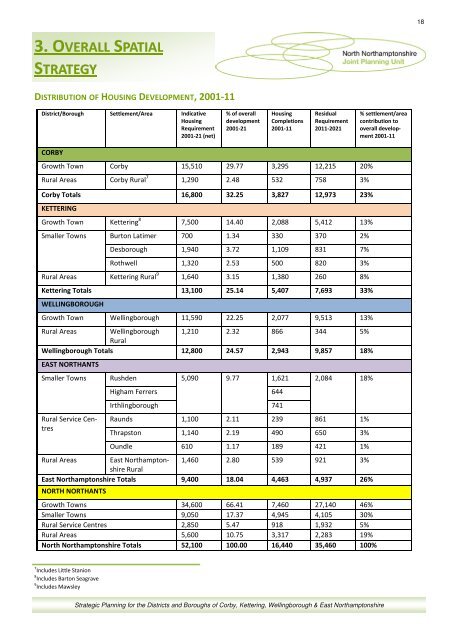
DISTRIBUTION OF HOUSING DEVELOPMENT, 2001-<strong>11</strong><br />
District/Borough Settlement/Area Indicative<br />
Housing<br />
Requirement<br />
2001-21 (net)<br />
% of overall<br />
development<br />
2001-21<br />
Housing<br />
Completions<br />
2001-<strong>11</strong><br />
Residual<br />
Requirement<br />
20<strong>11</strong>-2021<br />
% settlement/area<br />
contribution to<br />
overall development<br />
2001-<strong>11</strong><br />
CORBY<br />
Growth Town Corby 15,510 29.77 3,295 12,215 20%<br />
Rural Areas Corby Rural 7 1,290 2.48 532 758 3%<br />
Corby Totals 16,800 32.25 3,827 12,973 23%<br />
KETTERING<br />
Growth Town Kettering 8 7,500 14.40 2,088 5,412 13%<br />
Smaller Towns Burton Latimer 700 1.34 330 370 2%<br />
Desborough 1,940 3.72 1,109 831 7%<br />
Rothwell 1,320 2.53 500 820 3%<br />
Rural Areas Kettering Rural 9 1,640 3.15 1,380 260 8%<br />
Kettering Totals 13,100 25.14 5,407 7,693 33%<br />
WELLINGBOROUGH<br />
Growth Town Wellingborough <strong>11</strong>,590 22.25 2,077 9,513 13%<br />
Rural Areas Wellingborough 1,210 2.32 866 344 5%<br />
Rural<br />
Wellingborough Totals 12,800 24.57 2,943 9,857 18%<br />
EAST NORTHANTS<br />
Smaller Towns Rushden 5,090 9.77 1,621 2,084 18%<br />
Rural Service Centres<br />
Higham Ferrers 644<br />
Irthlingborough 741<br />
Raunds 1,100 2.<strong>11</strong> 239 861 1%<br />
Thrapston 1,140 2.19 490 650 3%<br />
Oundle 610 1.17 189 421 1%<br />
Rural Areas East <strong>North</strong>amptonshire<br />
1,460 2.80 539 921 3%<br />
Rural<br />
East <strong>North</strong>amptonshire Totals 9,400 18.04 4,463 4,937 26%<br />
NORTH NORTHANTS<br />
Growth Towns 34,600 66.41 7,460 27,140 46%<br />
Smaller Towns 9,050 17.37 4,945 4,105 30%<br />
Rural Service Centres 2,850 5.47 918 1,932 5%<br />
Rural Areas 5,600 10.75 3,317 2,283 19%<br />
<strong>North</strong> <strong>North</strong>amptonshire Totals 52,100 100.00 16,440 35,460 100%<br />
7 Includes Little Stanion<br />
8 Includes Barton Seagrave<br />
9 Includes Mawsley<br />
Strategic Planning for the Districts and Boroughs of Corby, Kettering, Wellingborough & East <strong>North</strong>amptonshire