North Northamptonshire Annual Monitoring Report 2010-11
North Northamptonshire Annual Monitoring Report 2010-11
North Northamptonshire Annual Monitoring Report 2010-11

You also want an ePaper? Increase the reach of your titles
YUMPU automatically turns print PDFs into web optimized ePapers that Google loves.
20<br />
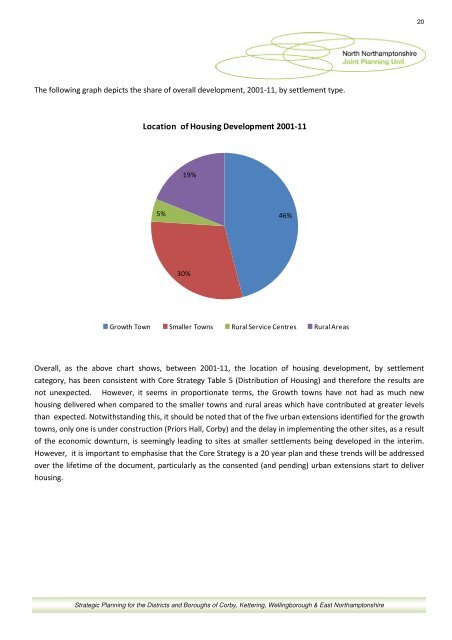
The following graph depicts the share of overall development, 2001-<strong>11</strong>, by settlement type.<br />
Location of Housing Development 2001-<strong>11</strong><br />
19%<br />
5%<br />
46%<br />
30%<br />
Growth Town Smaller Towns Rural Service Centres Rural Areas<br />
Overall, as the above chart shows, between 2001-<strong>11</strong>, the location of housing development, by settlement<br />
category, has been consistent with Core Strategy Table 5 (Distribution of Housing) and therefore the results are<br />
not unexpected. However, it seems in proportionate terms, the Growth towns have not had as much new<br />
housing delivered when compared to the smaller towns and rural areas which have contributed at greater levels<br />
than expected. Notwithstanding this, it should be noted that of the five urban extensions identified for the growth<br />
towns, only one is under construction (Priors Hall, Corby) and the delay in implementing the other sites, as a result<br />
of the economic downturn, is seemingly leading to sites at smaller settlements being developed in the interim.<br />
However, it is important to emphasise that the Core Strategy is a 20 year plan and these trends will be addressed<br />
over the lifetime of the document, particularly as the consented (and pending) urban extensions start to deliver<br />
housing.<br />
Strategic Planning for the Districts and Boroughs of Corby, Kettering, Wellingborough & East <strong>North</strong>amptonshire