FIELD TESTING AND EVALUATION OF DUST DEPOSITION AND ...
FIELD TESTING AND EVALUATION OF DUST DEPOSITION AND ...
FIELD TESTING AND EVALUATION OF DUST DEPOSITION AND ...
Create successful ePaper yourself
Turn your PDF publications into a flip-book with our unique Google optimized e-Paper software.
2.1 Dry Deposition<br />
There are a number of models available for dry deposition of particles. Three of<br />
them are presented below. Because it is widely cited and because it has been suggested<br />
for use in the Gillette Box Model, the formulation provided by Slinn (1982) is discussed<br />
at some length. One of the difficulties of using Slinn’s model is that the parameters<br />
required are numerous and difficult to specify. Simpler methods that are based on similar<br />
reasoning, but requiring fewer parameters, are used in the Industrial Source Complex<br />
utility (USEPA, 1995) and by Raupach (1999).<br />
Dry deposition is frequently modeled in analogy to resistance in an electrical<br />
circuit. The flux to the ground is assumed to be equal to the concentration measured at a<br />
given height multiplied by the mass transfer coefficient, which is also dependent on<br />
height. The mass transfer coefficient is called the deposition velocity and is given the<br />
symbol v d . Thus, according to the resistance model<br />
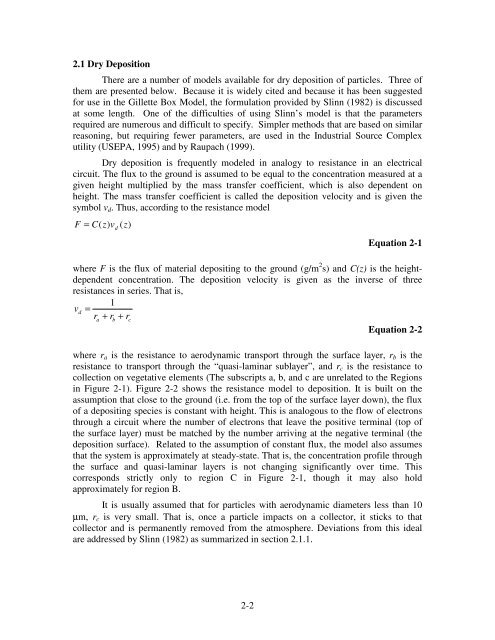
F = C( z)<br />
v ( z)<br />
d<br />
Equation 2-1<br />
where F is the flux of material depositing to the ground (g/m 2 s) and C(z) is the heightdependent<br />
concentration. The deposition velocity is given as the inverse of three<br />
resistances in series. That is,<br />
1<br />
vd<br />
=<br />
ra<br />
+ rb<br />
+ rc<br />
Equation 2-2<br />
where r a is the resistance to aerodynamic transport through the surface layer, r b is the<br />
resistance to transport through the “quasi-laminar sublayer”, and r c is the resistance to<br />
collection on vegetative elements (The subscripts a, b, and c are unrelated to the Regions<br />
in Figure 2-1). Figure 2-2 shows the resistance model to deposition. It is built on the<br />
assumption that close to the ground (i.e. from the top of the surface layer down), the flux<br />
of a depositing species is constant with height. This is analogous to the flow of electrons<br />
through a circuit where the number of electrons that leave the positive terminal (top of<br />
the surface layer) must be matched by the number arriving at the negative terminal (the<br />
deposition surface). Related to the assumption of constant flux, the model also assumes<br />
that the system is approximately at steady-state. That is, the concentration profile through<br />
the surface and quasi-laminar layers is not changing significantly over time. This<br />
corresponds strictly only to region C in Figure 2-1, though it may also hold<br />
approximately for region B.<br />
It is usually assumed that for particles with aerodynamic diameters less than 10<br />
µm, r c is very small. That is, once a particle impacts on a collector, it sticks to that<br />
collector and is permanently removed from the atmosphere. Deviations from this ideal<br />
are addressed by Slinn (1982) as summarized in section 2.1.1.<br />
2-2


