

FIELD TESTING AND EVALUATION OF DUST DEPOSITION AND ...
FIELD TESTING AND EVALUATION OF DUST DEPOSITION AND ...
FIELD TESTING AND EVALUATION OF DUST DEPOSITION AND ...

You also want an ePaper? Increase the reach of your titles
YUMPU automatically turns print PDFs into web optimized ePapers that Google loves.
1.E+05<br />
Deposition Velocity - cm/s<br />
1.E+03<br />
1.E+01<br />
1.E-01<br />
1.E-03<br />
0.1 1 10 100<br />
Physical Diameter - microns<br />
Clear Tape<br />
Dry Filter<br />
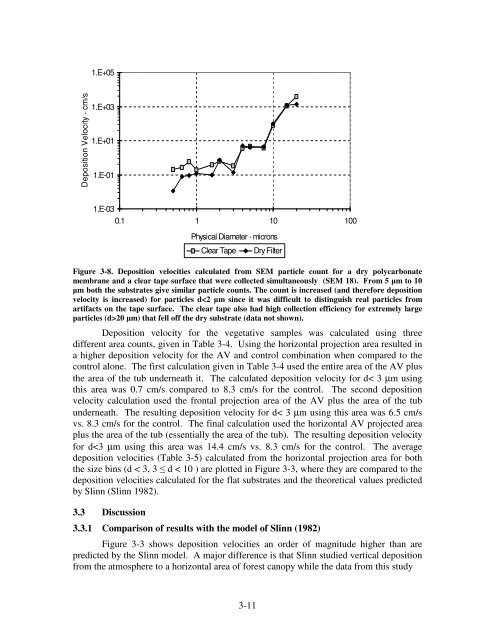
Figure 3-8. Deposition velocities calculated from SEM particle count for a dry polycarbonate<br />
membrane and a clear tape surface that were collected simultaneously (SEM 18). From 5 m to 10<br />
m both the substrates give similar particle counts. The count is increased (and therefore deposition<br />
velocity is increased) for particles d20 m) that fell off the dry substrate (data not shown).<br />
Deposition velocity for the vegetative samples was calculated using three<br />
different area counts, given in Table 3-4. Using the horizontal projection area resulted in<br />
a higher deposition velocity for the AV and control combination when compared to the<br />
control alone. The first calculation given in Table 3-4 used the entire area of the AV plus<br />
the area of the tub underneath it. The calculated deposition velocity for d< 3 µm using<br />
this area was 0.7 cm/s compared to 8.3 cm/s for the control. The second deposition<br />
velocity calculation used the frontal projection area of the AV plus the area of the tub<br />
underneath. The resulting deposition velocity for d< 3 µm using this area was 6.5 cm/s<br />
vs. 8.3 cm/s for the control. The final calculation used the horizontal AV projected area<br />
plus the area of the tub (essentially the area of the tub). The resulting deposition velocity<br />
for d


