

FIELD TESTING AND EVALUATION OF DUST DEPOSITION AND ...
FIELD TESTING AND EVALUATION OF DUST DEPOSITION AND ...
FIELD TESTING AND EVALUATION OF DUST DEPOSITION AND ...

Create successful ePaper yourself
Turn your PDF publications into a flip-book with our unique Google optimized e-Paper software.
6. DETERMINATION <strong>OF</strong> PARTICLE REMOVAL RATES UNDER<br />
STABLE CONDITIONS IN A MOCK URBAN SETTING<br />
As part of a DoD-funded study, the University of Utah measured vehiclegenerated<br />
road dust under stable atmospheric conditions at a flat site in the Utah west<br />
desert, and the horizontal flux of dust with the aid of interpolating functions that were fit<br />
to the wind speed and dust concentration measurements at discrete heights. The<br />
measured horizontal flux of dust and particle removal by deposition were compared to<br />
predictions by the one-dimensional Atmospheric Diffusion Equation (ADE) and the<br />
Industrial Source Complex (ISC) models.<br />
6.1 Experimental Methods<br />
The field measurements were conducted at the Dugway Proving Ground, Tooele<br />
County, Utah in collaboration with the Mock Urban Setting Test (MUST), an<br />
atmospheric dispersion experiment funded by the Defense Threat Reduction Agency<br />
(Biltoft, 2001; Yee and Biltoft, 2002). The site is located at 40° 12.6' N, 113° 10.6' W<br />
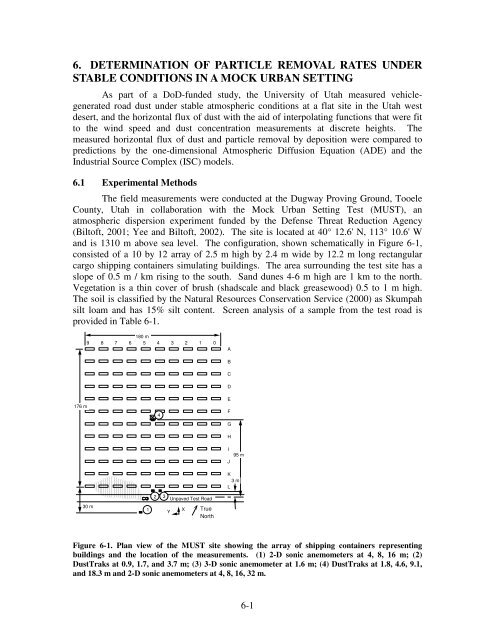
and is 1310 m above sea level. The configuration, shown schematically in Figure 6-1,<br />
consisted of a 10 by 12 array of 2.5 m high by 2.4 m wide by 12.2 m long rectangular<br />
cargo shipping containers simulating buildings. The area surrounding the test site has a<br />
slope of 0.5 m / km rising to the south. Sand dunes 4-6 m high are 1 km to the north.<br />
Vegetation is a thin cover of brush (shadscale and black greasewood) 0.5 to 1 m high.<br />
The soil is classified by the Natural Resources Conservation Service (2000) as Skumpah<br />
silt loam and has 15% silt content. Screen analysis of a sample from the test road is<br />
provided in Table 6-1.<br />
180 m<br />
9 8 7 6 5 4 3 2 1 0<br />
A<br />
B<br />
C<br />
D<br />
176 m<br />
4<br />
E<br />
F<br />
G<br />
H<br />
I<br />
J<br />
95 m<br />
30 m<br />
1<br />
2 3<br />
Y<br />
Unpaved Test Road<br />
X<br />
True<br />
North<br />
K<br />
3 m<br />
L<br />
Figure 6-1. Plan view of the MUST site showing the array of shipping containers representing<br />
buildings and the location of the measurements. (1) 2-D sonic anemometers at 4, 8, 16 m; (2)<br />
DustTraks at 0.9, 1.7, and 3.7 m; (3) 3-D sonic anemometer at 1.6 m; (4) DustTraks at 1.8, 4.6, 9.1,<br />
and 18.3 m and 2-D sonic anemometers at 4, 8, 16, 32 m.<br />
6-1


