Flute acoustics: measurement, modelling and design - School of ...
Flute acoustics: measurement, modelling and design - School of ...
Flute acoustics: measurement, modelling and design - School of ...

Create successful ePaper yourself
Turn your PDF publications into a flip-book with our unique Google optimized e-Paper software.
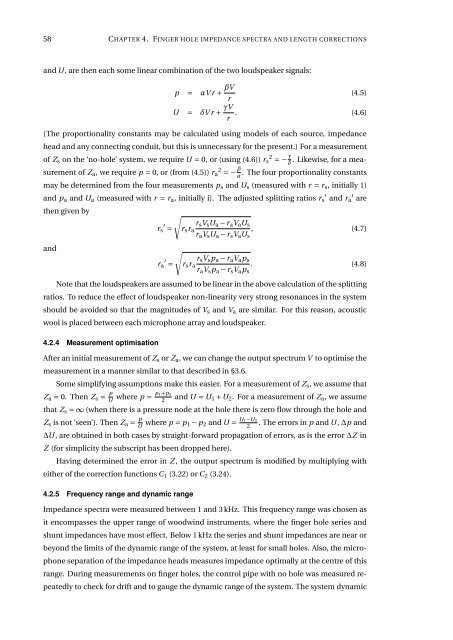
58 CHAPTER 4. FINGER HOLE IMPEDANCE SPECTRA AND LENGTH CORRECTIONS<br />
<strong>and</strong> U, are then each some linear combination <strong>of</strong> the two loudspeaker signals:<br />
p = αVr+ βV r<br />
(4.5)<br />
U = δVr+ γV r . (4.6)<br />
(The proportionality constants may be calculated using models <strong>of</strong> each source, impedance<br />
head <strong>and</strong> any connecting conduit, but this is unnecessary for the present.) For a <strong>measurement</strong><br />
<strong>of</strong> Z s on the ‘no-hole’ system, we require U = 0, or (using (4.6)) r 2 s =− γ δ<br />
. Likewise, for a <strong>measurement</strong><br />
<strong>of</strong> Z a , we require p = 0, or (from (4.5)) r 2 a =− β α<br />
. The four proportionality constants<br />
may be determined from the four <strong>measurement</strong>s p s <strong>and</strong> U s (measured with r = r s , initially 1)<br />
<strong>and</strong> p a <strong>and</strong> U a (measured with r = r a , initially i). The adjusted splitting ratios r ′ s <strong>and</strong> r ′ a are<br />
then given by<br />
√<br />
r ′ r s V s U a − r a V a U s<br />
s = r s r a , (4.7)<br />
r a V s U a − r s V a U s<br />
<strong>and</strong><br />
√<br />
r ′ r s V s p a − r a V a p s<br />
a = r s r a . (4.8)<br />
r a V s p a − r s V a p s<br />
Note that the loudspeakers are assumed to be linear in the above calculation <strong>of</strong> the splitting<br />
ratios. To reduce the effect <strong>of</strong> loudspeaker non-linearity very strong resonances in the system<br />
should be avoided so that the magnitudes <strong>of</strong> V s <strong>and</strong> V a are similar. For this reason, acoustic<br />
wool is placed between each microphone array <strong>and</strong> loudspeaker.<br />
4.2.4 Measurement optimisation<br />
After an initial <strong>measurement</strong> <strong>of</strong> Z s or Z a , we can change the output spectrum V to optimise the<br />
<strong>measurement</strong> in a manner similar to that described in §3.6.<br />
Some simplifying assumptions make this easier. For a <strong>measurement</strong> <strong>of</strong> Z s , we assume that<br />
Z a = 0. Then Z s = p U where p = p 1+p 2<br />
2<br />
<strong>and</strong> U = U 1 +U 2 . For a <strong>measurement</strong> <strong>of</strong> Z a , we assume<br />
that Z s =∞(when there is a pressure node at the hole there is zero flow through the hole <strong>and</strong><br />
Z s is not ‘seen’). Then Z a = p U where p = p 1 − p 2 <strong>and</strong> U = U 1−U 2<br />
2<br />
. The errors in p <strong>and</strong> U, ∆p <strong>and</strong><br />
∆U, are obtained in both cases by straight-forward propagation <strong>of</strong> errors, as is the error ∆Z in<br />
Z (for simplicity the subscript has been dropped here).<br />
Having determined the error in Z , the output spectrum is modified by multiplying with<br />
either <strong>of</strong> the correction functions C 1 (3.22) or C 2 (3.24).<br />
4.2.5 Frequency range <strong>and</strong> dynamic range<br />
Impedance spectra were measured between 1 <strong>and</strong> 3 kHz. This frequency range was chosen as<br />
it encompasses the upper range <strong>of</strong> woodwind instruments, where the finger hole series <strong>and</strong><br />
shunt impedances have most effect. Below 1 kHz the series <strong>and</strong> shunt impedances are near or<br />
beyond the limits <strong>of</strong> the dynamic range <strong>of</strong> the system, at least for small holes. Also, the microphone<br />
separation <strong>of</strong> the impedance heads measures impedance optimally at the centre <strong>of</strong> this<br />
range. During <strong>measurement</strong>s on finger holes, the control pipe with no hole was measured repeatedly<br />
to check for drift <strong>and</strong> to gauge the dynamic range <strong>of</strong> the system. The system dynamic