Singapore Press Holdings annual report 2011 Singapore Press ...
Singapore Press Holdings annual report 2011 Singapore Press ...
Singapore Press Holdings annual report 2011 Singapore Press ...

Create successful ePaper yourself
Turn your PDF publications into a flip-book with our unique Google optimized e-Paper software.
72<br />
<strong>Singapore</strong> <strong>Press</strong> <strong>Holdings</strong> <strong>annual</strong> <strong>report</strong> <strong>2011</strong><br />
Financial<br />
REVIEW<br />
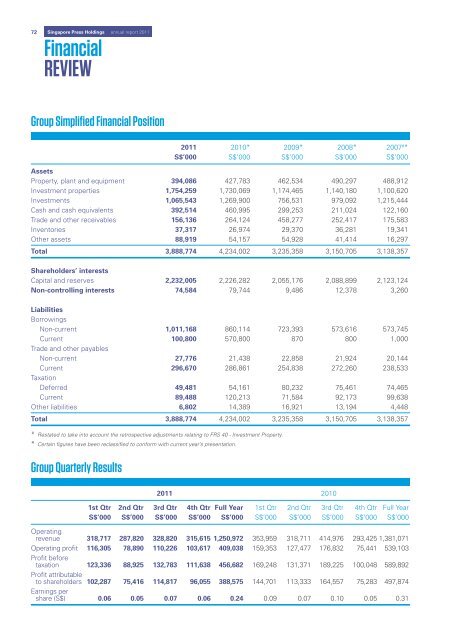
Group Simplified Financial Position<br />
<strong>2011</strong> 2010* 2009* 2008* 2007 # *<br />
S$’000 S$’000 S$’000 S$’000 S$’000<br />
Assets<br />
Property, plant and equipment 394,086 427,783 462,534 490,297 488,912<br />
Investment properties 1,754,259 1,730,069 1,174,465 1,140,180 1,100,620<br />
Investments 1,065,543 1,269,900 756,531 979,092 1,215,444<br />
Cash and cash equivalents 392,514 460,995 299,253 211,024 122,160<br />
Trade and other receivables 156,136 264,124 458,277 252,417 175,583<br />
Inventories 37,317 26,974 29,370 36,281 19,341<br />
Other assets 88,919 54,157 54,928 41,414 16,297<br />
Total 3,888,774 4,234,002 3,235,358 3,150,705 3,138,357<br />
Shareholders’ interests<br />
Capital and reserves 2,232,005 2,226,282 2,055,176 2,088,899 2,123,124<br />
Non-controlling interests 74,584 79,744 9,486 12,378 3,260<br />
Liabilities<br />
Borrowings<br />
Non-current 1,011,168 860,114 723,393 573,616 573,745<br />
Current 100,800 570,800 870 800 1,000<br />
Trade and other payables<br />
Non-current 27,776 21,438 22,858 21,924 20,144<br />
Current 296,670 286,861 254,838 272,260 238,533<br />
Taxation<br />
Deferred 49,481 54,161 80,232 75,461 74,465<br />
Current 89,488 120,213 71,584 92,173 99,638<br />
Other liabilities 6,802 14,389 16,921 13,194 4,448<br />
Total 3,888,774 4,234,002 3,235,358 3,150,705 3,138,357<br />
# Restated to take into account the retrospective adjustments relating to FRS 40 - Investment Property.<br />
* Certain figures have been reclassified to conform with current year’s presentation.<br />
Group Quarterly Results<br />
<strong>2011</strong> 2010<br />
1st Qtr 2nd Qtr 3rd Qtr 4th Qtr Full Year 1st Qtr 2nd Qtr 3rd Qtr 4th Qtr Full Year<br />
S$’000 S$’000 S$’000 S$’000 S$’000 S$’000 S$’000 S$’000 S$’000 S$’000<br />
Operating<br />
revenue 318,717 287,820 328,820 315,615 1,250,972 353,959 318,711 414,976 293,425 1,381,071<br />
Operating profit 116,305 78,890 110,226 103,617 409,038 159,353 127,477 176,832 75,441 539,103<br />
Profit before<br />
taxation 123,336 88,925 132,783 111,638 456,682 169,248 131,371 189,225 100,048 589,892<br />
Profit attributable<br />
to shareholders 102,287 75,416 114,817 96,055 388,575 144,701 113,333 164,557 75,283 497,874<br />
Earnings per<br />
share (S$) 0.06 0.05 0.07 0.06 0.24 0.09 0.07 0.10 0.05 0.31