Poster abstracts and manuscripts from the Third International ...
Poster abstracts and manuscripts from the Third International ...
Poster abstracts and manuscripts from the Third International ...
You also want an ePaper? Increase the reach of your titles
YUMPU automatically turns print PDFs into web optimized ePapers that Google loves.
21<br />
"What sample size <strong>and</strong> sampling frequency are necessary to detect<br />
a decrease of 20% in debris over five years?,,<br />
The approach follows <strong>the</strong> outline of power analysis presented in<br />
Muller et al. (1992). The multivariate linear model upon which<br />
this analysis is based is a repeated measures model with one<br />
within subject factor, time, that occurs at p time points (i.e.,<br />
p-5 for annual surveys). Assumptions made are homogeneity of<br />
variance (i.e., <strong>the</strong> error structure is <strong>the</strong> same between survey<br />
units <strong>and</strong>, hence, between regions), independent survey units, <strong>and</strong><br />
that <strong>the</strong> debris on beaches can be modelled using a multivariate<br />
normal distribution.<br />
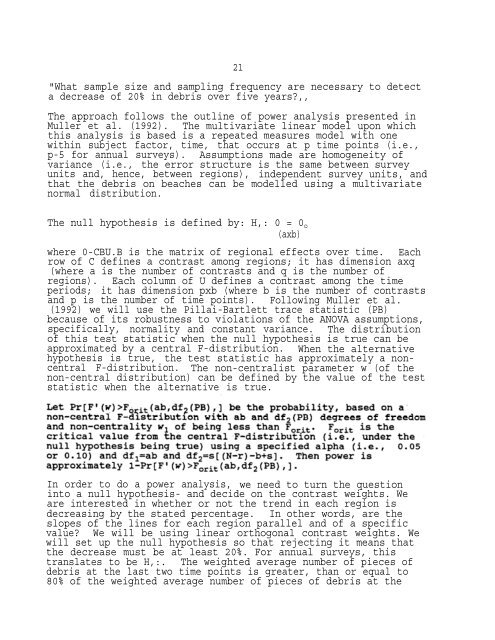
The null hypo<strong>the</strong>sis is defined by: H,: 0 = 0 o<br />
(axb)<br />
where 0-CBU.B is <strong>the</strong> matrix of regional effects over time. Each<br />
row of C defines a contrast among regions; it has dimension axq<br />
(where a is <strong>the</strong> number of contrasts <strong>and</strong> q is <strong>the</strong> number of<br />
regions). Each column of U defines a contrast among <strong>the</strong> time<br />
periods; it has dimension pxb (where b is <strong>the</strong> number of contrasts<br />
<strong>and</strong> p is <strong>the</strong> number of time points). Following Muller et al.<br />
(1992) we will use <strong>the</strong> Pillai-Bartlett trace statistic (PB)<br />
because of its robustness to violations of <strong>the</strong> ANOVA assumptions,<br />
specifically, normality <strong>and</strong> constant variance. The distribution<br />
of this test statistic when <strong>the</strong> null hypo<strong>the</strong>sis is true can be<br />
approximated by a central F-distribution. When <strong>the</strong> alternative<br />
hypo<strong>the</strong>sis is true, <strong>the</strong> test statistic has approximately a noncentral<br />
F-distribution. The non-centralist parameter w (of <strong>the</strong><br />
non-central distribution) can be defined by <strong>the</strong> value of <strong>the</strong> test<br />
statistic when <strong>the</strong> alternative is true.<br />
In order to do a power analysis, we need to turn <strong>the</strong> question<br />
into a null hypo<strong>the</strong>sis- <strong>and</strong> decide on <strong>the</strong> contrast weights. We<br />
are interested in whe<strong>the</strong>r or not <strong>the</strong> trend in each region is<br />
decreasing by <strong>the</strong> stated percentage. In o<strong>the</strong>r words, are <strong>the</strong><br />
slopes of <strong>the</strong> lines for each region parallel <strong>and</strong> of a specific<br />
value? We will be using linear orthogonal contrast weights. We<br />
will set up <strong>the</strong> null hypo<strong>the</strong>sis so that rejecting it means that<br />
<strong>the</strong> decrease must be at least 20%. For annual surveys, this<br />
translates to be H,:. The weighted average number of pieces of<br />
debris at <strong>the</strong> last two time points is greater, than or equal to<br />
80% of <strong>the</strong> weighted average number of pieces of debris at <strong>the</strong>


