

mixed - Stata
mixed - Stata
mixed - Stata

You also want an ePaper? Increase the reach of your titles
YUMPU automatically turns print PDFs into web optimized ePapers that Google loves.
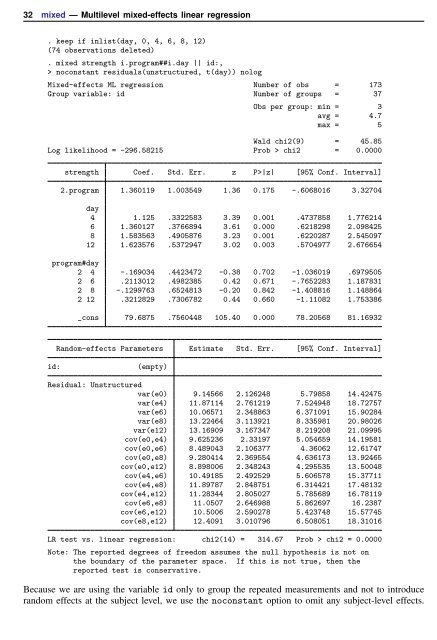
32 <strong>mixed</strong> — Multilevel <strong>mixed</strong>-effects linear regression<br />
. keep if inlist(day, 0, 4, 6, 8, 12)<br />
(74 observations deleted)<br />
. <strong>mixed</strong> strength i.program##i.day || id:,<br />
> noconstant residuals(unstructured, t(day)) nolog<br />
Mixed-effects ML regression Number of obs = 173<br />
Group variable: id Number of groups = 37<br />
Obs per group: min = 3<br />
avg = 4.7<br />
max = 5<br />
Wald chi2(9) = 45.85<br />
Log likelihood = -296.58215 Prob > chi2 = 0.0000<br />
strength Coef. Std. Err. z P>|z| [95% Conf. Interval]<br />
2.program 1.360119 1.003549 1.36 0.175 -.6068016 3.32704<br />
day<br />
4 1.125 .3322583 3.39 0.001 .4737858 1.776214<br />
6 1.360127 .3766894 3.61 0.000 .6218298 2.098425<br />
8 1.583563 .4905876 3.23 0.001 .6220287 2.545097<br />
12 1.623576 .5372947 3.02 0.003 .5704977 2.676654<br />
program#day<br />
2 4 -.169034 .4423472 -0.38 0.702 -1.036019 .6979505<br />
2 6 .2113012 .4982385 0.42 0.671 -.7652283 1.187831<br />
2 8 -.1299763 .6524813 -0.20 0.842 -1.408816 1.148864<br />
2 12 .3212829 .7306782 0.44 0.660 -1.11082 1.753386<br />
_cons 79.6875 .7560448 105.40 0.000 78.20568 81.16932<br />
Random-effects Parameters Estimate Std. Err. [95% Conf. Interval]<br />
id:<br />
(empty)<br />
Residual: Unstructured<br />
var(e0) 9.14566 2.126248 5.79858 14.42475<br />
var(e4) 11.87114 2.761219 7.524948 18.72757<br />
var(e6) 10.06571 2.348863 6.371091 15.90284<br />
var(e8) 13.22464 3.113921 8.335981 20.98026<br />
var(e12) 13.16909 3.167347 8.219208 21.09995<br />
cov(e0,e4) 9.625236 2.33197 5.054659 14.19581<br />
cov(e0,e6) 8.489043 2.106377 4.36062 12.61747<br />
cov(e0,e8) 9.280414 2.369554 4.636173 13.92465<br />
cov(e0,e12) 8.898006 2.348243 4.295535 13.50048<br />
cov(e4,e6) 10.49185 2.492529 5.606578 15.37711<br />
cov(e4,e8) 11.89787 2.848751 6.314421 17.48132<br />
cov(e4,e12) 11.28344 2.805027 5.785689 16.78119<br />
cov(e6,e8) 11.0507 2.646988 5.862697 16.2387<br />
cov(e6,e12) 10.5006 2.590278 5.423748 15.57745<br />
cov(e8,e12) 12.4091 3.010796 6.508051 18.31016<br />
LR test vs. linear regression: chi2(14) = 314.67 Prob > chi2 = 0.0000<br />
Note: The reported degrees of freedom assumes the null hypothesis is not on<br />
the boundary of the parameter space. If this is not true, then the<br />
reported test is conservative.<br />
Because we are using the variable id only to group the repeated measurements and not to introduce<br />
random effects at the subject level, we use the noconstant option to omit any subject-level effects.


