

FINAL REPORT
FINAL REPORT
FINAL REPORT

You also want an ePaper? Increase the reach of your titles
YUMPU automatically turns print PDFs into web optimized ePapers that Google loves.
Crops Potatoes Carrots Tomatoes Cucumbers<br />
Onions Cabbages Turnips Watermelons<br />
Honeydew<br />
Melons<br />
Price 70-400 70-700 150-1000 150-500 150- 80-300 70-200 100- 150-500<br />
(MNT)<br />
1000<br />
400<br />
Average 150 150 400 200 400 150 150 175 200<br />
price*<br />
(MNT)<br />
Marketed 183.3 15.5 5 5.7 0.28 7 8 30 9<br />
amount (t)<br />
Revenues 27.5 2.33 2 1.14 0.11 1.05 1.2 5.25 1.8<br />
(Million<br />
MNT)<br />
*for which most farmers sold their crops<br />
Source: Survey results, June<br />
2006<br />
Table 28: Crop Prices paid to Surveyed Households and Revenues from Marketing, Myangad sum<br />
(2005/06)<br />
Thus calculated, on average each household had approximately 7million MNTrevenues from<br />
crop marketing. The average expenses for inputs, services and labor force were reported to be<br />
360,000 MNT per household. 24 Thus an average household’s income from crop farming is<br />
approximately 6.7 million MNT.<br />
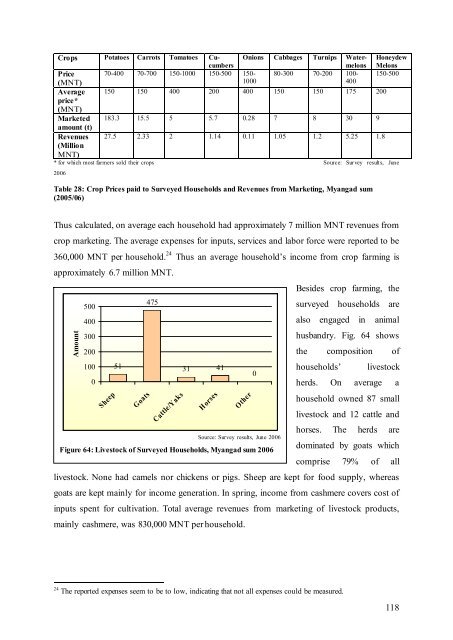
Besides crop farming, the<br />
Amount<br />
475<br />
500<br />
surveyed households are<br />
400<br />
also engaged in animal<br />
300<br />
husbandry. Fig. 64 shows<br />
200<br />
the composition of<br />
100 51<br />
31 41<br />
households’ livestock<br />
0<br />
0<br />
herds. On average a<br />
Sheep<br />
Goats<br />
Cattle/Yaks<br />
Horses<br />
Other<br />
Source: Survey results, June 2006<br />
Figure 64: Livestock of Surveyed Households, Myangad sum 2006<br />
household owned 87 small<br />
livestock and 12 cattle and<br />
horses. The herds are<br />
dominated by goats which<br />
comprise 79% of all<br />
livestock. None had camels nor chickens or pigs. Sheep are kept for food supply, whereas<br />
goats are kept mainly for income generation. In spring, income from cashmere covers cost of<br />
inputs spent for cultivation. Total average revenues from marketing of livestock products,<br />
mainly cashmere, was 830,000MNTper household.<br />
24 The reported expenses seem to be to low, indicating that not all expenses could be measured.<br />
118


