

FINAL REPORT
FINAL REPORT
FINAL REPORT

Create successful ePaper yourself
Turn your PDF publications into a flip-book with our unique Google optimized e-Paper software.
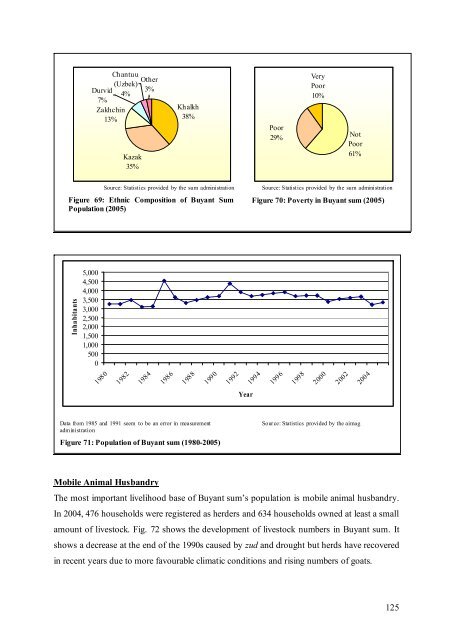
Chantuu<br />
(Uzbek)<br />
Durvid<br />
4%<br />
7%<br />
Zakhchin<br />
13%<br />
Kazak<br />
35%<br />
Other<br />
3%<br />
Khalkh<br />
38%<br />
Poor<br />
29%<br />
Very<br />
Poor<br />
10%<br />
Not<br />
Poor<br />
61%<br />
Source: Statistics provided by the sum administration<br />
Figure 69: Ethnic Composition of Buyant Sum<br />
Population(2005)<br />
Source: Statistics provided by the sum administration<br />
Figure 70: Poverty in Buyant sum (2005)<br />
Inha bita nts<br />
5,000<br />
4,500<br />
4,000<br />
3,500<br />
3,000<br />
2,500<br />
2,000<br />
1,500<br />
1,000<br />
500<br />
0<br />
1980<br />
1982<br />
1984<br />
1986<br />
1988<br />
1990<br />
1992<br />
1994<br />
1996<br />
1998<br />
2000<br />
2002<br />
2004<br />
Year<br />
Data from 1985 and 1991 seem to be an error in measurement<br />
administration<br />
Figure 71: Population of Buyant sum (1980-2005)<br />
Source:Statistics provided by theaimag<br />
Mobile Animal Husbandry<br />
The most important livelihood base of Buyant sum’s population is mobile animal husbandry.<br />
In 2004, 476 households were registered as herders and 634 households owned at least a small<br />
amount of livestock. Fig. 72 shows the development of livestock numbers in Buyant sum. It<br />
shows a decrease at the end of the 1990s caused by zud and drought but herds have recovered<br />
in recent years due to more favourable climatic conditions and rising numbers of goats.<br />
125


