Kenosha State of Downtown Report.indd - The Lakota Group
Kenosha State of Downtown Report.indd - The Lakota Group
Kenosha State of Downtown Report.indd - The Lakota Group

Create successful ePaper yourself
Turn your PDF publications into a flip-book with our unique Google optimized e-Paper software.
SECTION 4: MARKET ANALYSIS<br />
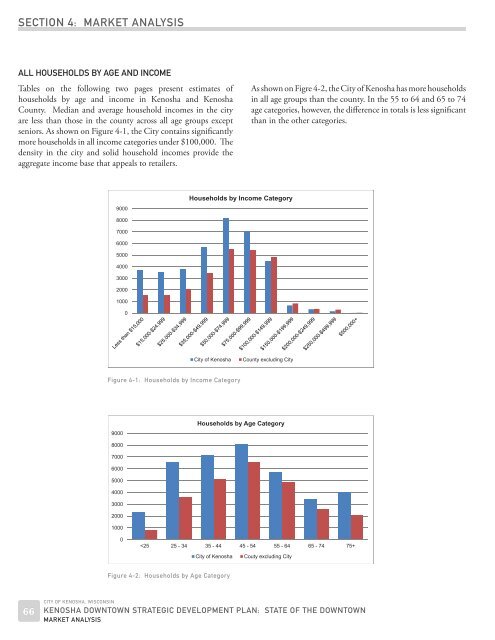
ALL HOUSEHOLDS BY AGE AND INCOME<br />
Tables on the following two pages present estimates <strong>of</strong><br />
households by age and income in <strong>Kenosha</strong> and <strong>Kenosha</strong><br />
County. Median and average household incomes in the city<br />
are less than those in the county across all age groups except<br />
seniors. As shown on Figure 4-1, the City contains significantly<br />
more households in all income categories under $100,000. <strong>The</strong><br />
density in the city and solid household incomes provide the<br />
aggregate income base that appeals to retailers.<br />
As shown on Figre 4-2, the City <strong>of</strong> <strong>Kenosha</strong> has more households<br />
in all age groups than the county. In the 55 to 64 and 65 to 74<br />
age categories, however, the difference in totals is less significant<br />
than in the other categories.<br />
9000<br />
Households by Income Category<br />
8000<br />
7000<br />
6000<br />
5000<br />
4000<br />
3000<br />
2000<br />
1000<br />
0<br />
City <strong>of</strong> <strong>Kenosha</strong><br />
County excluding City<br />
Figure 4-1: Households by Income Category<br />
9000<br />
Households by Age Category<br />
8000<br />
7000<br />
6000<br />
5000<br />
4000<br />
3000<br />
2000<br />
1000<br />
0<br />