Kenosha State of Downtown Report.indd - The Lakota Group
Kenosha State of Downtown Report.indd - The Lakota Group
Kenosha State of Downtown Report.indd - The Lakota Group

Create successful ePaper yourself
Turn your PDF publications into a flip-book with our unique Google optimized e-Paper software.
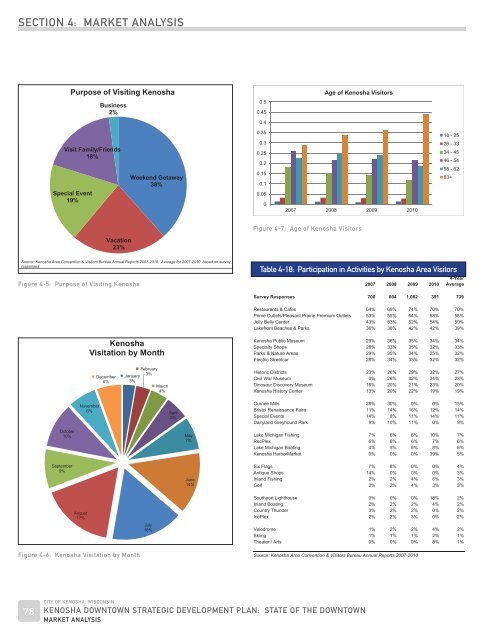
SECTION 4: MARKET ANALYSIS<br />
Purpose <strong>of</strong> Visiting <strong>Kenosha</strong><br />
Business<br />
2%<br />
Business<br />
2%<br />
0.5<br />
0.45<br />
0.4<br />
Age <strong>of</strong> <strong>Kenosha</strong> Visitors<br />
Visit Family/Friends<br />
18%<br />
u pose o s t g e os a<br />
Visit Family/Friends<br />
18%<br />
Special Event<br />
19%<br />
Special Event<br />
19%<br />
Visit Family/Friends<br />
18%<br />
Business Weekend Getaway<br />
2% 38%<br />
Vacation<br />
23% Weekend Getaway<br />
38%<br />
rce: <strong>Kenosha</strong> Area Convention & Visitors Special Bureau Event Annual <strong>Report</strong>s 2007-2010, Average for 2007-2010 based on survey<br />
onses<br />
19%<br />
Vacation<br />
23%<br />
Vacation<br />
23%<br />
Weekend Getaway<br />
38%<br />
0.35<br />
0.3<br />
0.25<br />
0.2<br />
0.15<br />
0.1<br />
0.05<br />
0<br />
2007 2008 2009 2010<br />
Figure 4-7: Age <strong>of</strong> <strong>Kenosha</strong> Visitors<br />
18 - 25<br />
26 - 33<br />
34 - 45<br />
46 - 54<br />
55 - 62<br />
63+<br />
Source: <strong>Kenosha</strong> Area Convention & Visitors Bureau Annual <strong>Report</strong>s 2007-2010, Average for 2007-2010 based on survey<br />
responses<br />
Figure 4-5: Purpose <strong>of</strong> Visiting <strong>Kenosha</strong><br />
Table 4-18: Participation in Activities by <strong>Kenosha</strong> Area Visitors<br />
Participation in Activities by <strong>Kenosha</strong> Area Visitors<br />
2007 2008 2009 2010<br />
4-Year<br />
Average<br />
Survey Responses 700 804 1,062 391 739<br />
<strong>Kenosha</strong><br />
tion by Month<br />
October<br />
10%<br />
September<br />
9%<br />
<strong>Kenosha</strong><br />
Visitation by Month<br />
November<br />
6%<br />
December<br />
6%<br />
January<br />
3%<br />
February<br />
3%<br />
March<br />
4%<br />
April<br />
5%<br />
May<br />
7%<br />
June<br />
14%<br />
Restaurants & Cafes 64% 69% 74% 70% 70%<br />
Prime Outlets/Pleasant Prairie Premium Outlets 53% 55% 64% 58% 58%<br />
Jelly Belly Center 43% 53% 52% 54% 50%<br />
Lakefront Beaches & Parks 36% 38% 42% 42% 39%<br />
<strong>Kenosha</strong> Public Museum 29% 36% 35% 34% 34%<br />
Specialty Shops 28% 33% 35% 32% 33%<br />
Parks & Nature Areas 29% 35% 34% 25% 32%<br />
Electric Streetcar 28% 34% 33% 32% 32%<br />
Historic Districts 23% 26% 29% 32% 27%<br />
Civil War Museum 0% 26% 32% 34% 23%<br />
Dinosaur Discovery Museum 16% 20% 21% 23% 20%<br />
<strong>Kenosha</strong> History Center 13% 20% 22% 19% 19%<br />
Gurnee Mills 28% 30% 0% 0% 15%<br />
Bristol Renaissance Faire 11% 14% 16% 12% 14%<br />
Special Events 14% 8% 11% 14% 11%<br />
Dairyland Greyhound Park 9% 10% 11% 0% 9%<br />
Lake Michigan Fishing 7% 6% 6% 10% 7%<br />
RecPlex 6% 6% 6% 7% 6%<br />
Lake Michigan Boating 4% 5% 6% 8% 6%<br />
<strong>Kenosha</strong> HarborMarket 0% 0% 0% 39% 5%<br />
Six Flags 7% 8% 0% 0% 4%<br />
Antique Shops 14% 0% 0% 0% 3%<br />
Inland Fishing 2% 2% 4% 6% 3%<br />
Golf 2% 2% 4% 3% 3%<br />
August<br />
17%<br />
Figure 4-6: <strong>Kenosha</strong> Visitation by Month<br />
July<br />
16%<br />
Southport Lighthouse 0% 0% 0% 18% 2%<br />
Inland Boating 2% 2% 2% 4% 2%<br />
Country Thunder 3% 2% 2% 0% 2%<br />
IcePlex 2% 2% 3% 0% 2%<br />
Velodrome 1% 2% 2% 4% 2%<br />
Skiing 1% 1% 1% 2% 1%<br />
<strong>The</strong>ater / Arts 0% 0% 0% 8% 1%<br />
Source: <strong>Kenosha</strong> Area Convention & Visitors Bureau Annual <strong>Report</strong>s 2007-2010<br />
78<br />
CITY OF KENOSHA, WISCONSIN<br />
KENOSHA DOWNTOWN STRATEGIC DEVELOPMENT PLAN: STATE OF THE DOWNTOWN<br />
MARKET ANALYSIS