Kenosha State of Downtown Report.indd - The Lakota Group
Kenosha State of Downtown Report.indd - The Lakota Group
Kenosha State of Downtown Report.indd - The Lakota Group

Create successful ePaper yourself
Turn your PDF publications into a flip-book with our unique Google optimized e-Paper software.
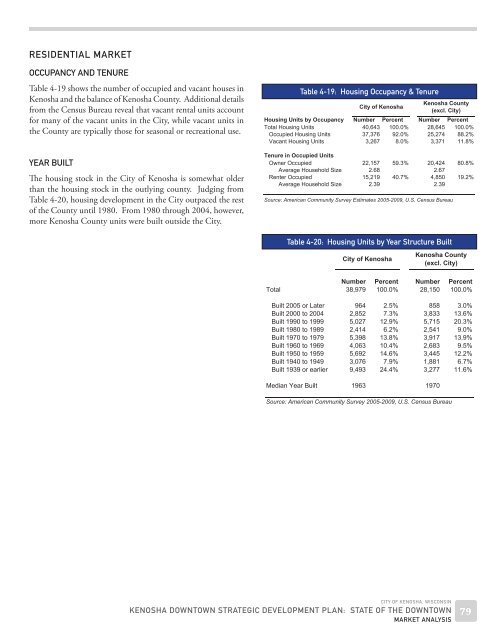
RESIDENTIAL MARKET<br />
OCCUPANCY AND TENURE<br />
Table 4-19 shows the number <strong>of</strong> occupied and vacant houses in<br />
<strong>Kenosha</strong> and the balance <strong>of</strong> <strong>Kenosha</strong> County. Additional details<br />
from the Census Bureau reveal that vacant rental units account<br />
for many <strong>of</strong> the vacant units in the City, while vacant units in<br />
the County are typically those for seasonal or recreational use.<br />
YEAR BUILT<br />
<strong>The</strong> housing stock in the City <strong>of</strong> <strong>Kenosha</strong> is somewhat older<br />
than the housing stock in the outlying county. Judging from<br />
Table 4-20, housing development in the City outpaced the rest<br />
<strong>of</strong> the County until 1980. From 1980 through 2004, however,<br />
more <strong>Kenosha</strong> County units were built outside the City.<br />
Table 4-19: Housing Housing Occupancy Occupancy and Tenure & Tenure<br />
City <strong>of</strong> <strong>Kenosha</strong><br />
<strong>Kenosha</strong> County<br />
(excl. City)<br />
Housing Units by Occupancy Number Percent Number Percent<br />
Total Housing Units 40,643 100.0% 28,645 100.0%<br />
Occupied Housing Units 37,376 92.0% 25,274 88.2%<br />
Vacant Housing Units 3,267 8.0% 3,371 11.8%<br />
Tenure in Occupied Units<br />
Owner Occupied 22,157 59.3% 20,424 80.8%<br />
Average Household Size 2.68 2.67<br />
Renter Occupied 15,219 40.7% 4,850 19.2%<br />
Average Household Size 2.39 2.39<br />
Source: American Community Survey Estimates 2005-2009, U.S. Census Bureau<br />
Table 4-20: Housing Housing Units Units by Year by Structure Year Structure Built Built<br />
City <strong>of</strong> <strong>Kenosha</strong><br />
Number Percent Number Percent<br />
Total 38,979 100.0% 28,150 100.0%<br />
Built 2005 or Later 964 2.5% 858 3.0%<br />
Built 2000 to 2004 2,852 7.3% 3,833 13.6%<br />
Built 1990 to 1999 5,027 12.9% 5,715 20.3%<br />
Built 1980 to 1989 2,414 6.2% 2,541 9.0%<br />
Built 1970 to 1979 5,398 13.8% 3,917 13.9%<br />
Built 1960 to 1969 4,063 10.4% 2,683 9.5%<br />
Built 1950 to 1959 5,692 14.6% 3,445 12.2%<br />
Built 1940 to 1949 3,076 7.9% 1,881 6.7%<br />
Built 1939 or earlier 9,493 24.4% 3,277 11.6%<br />
Median Year Built 1963 1970<br />
<strong>Kenosha</strong> County<br />
(excl. City)<br />
Source: American Community Survey 2005-2009, U.S. Census Bureau<br />
CITY OF KENOSHA, WISCONSIN<br />
KENOSHA DOWNTOWN STRATEGIC DEVELOPMENT PLAN: STATE OF THE DOWNTOWN<br />
MARKET ANALYSIS<br />
79